Solar Panel Output Calculator: From the Label to the Meter
Rated Power and Real Output Are Not the Same
Every solar panel has a rating in watts, measured at standard test conditions (STC): 1000 W/m² of light and a cell at 25°C. A real panel almost never sees both at once. When the light is strong the cell is hot, and when the cell is cool the light is weak. On top of that, some light reflects off the glass, dust blocks some more, and the cables and the inverter take their share. This solar panel output calculator works through all of it, so you see what one panel and the whole system really deliver, and where the rest goes.
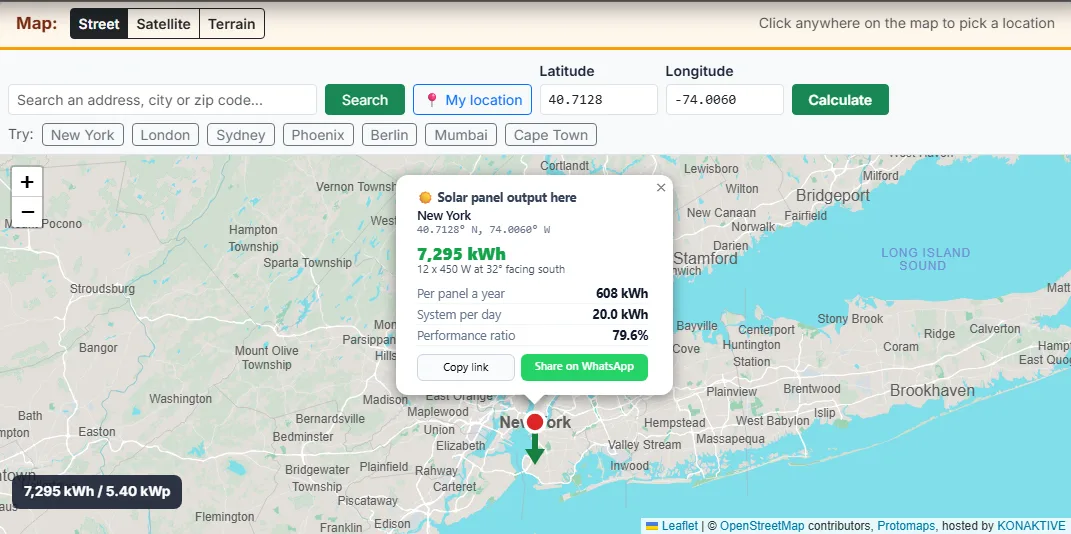
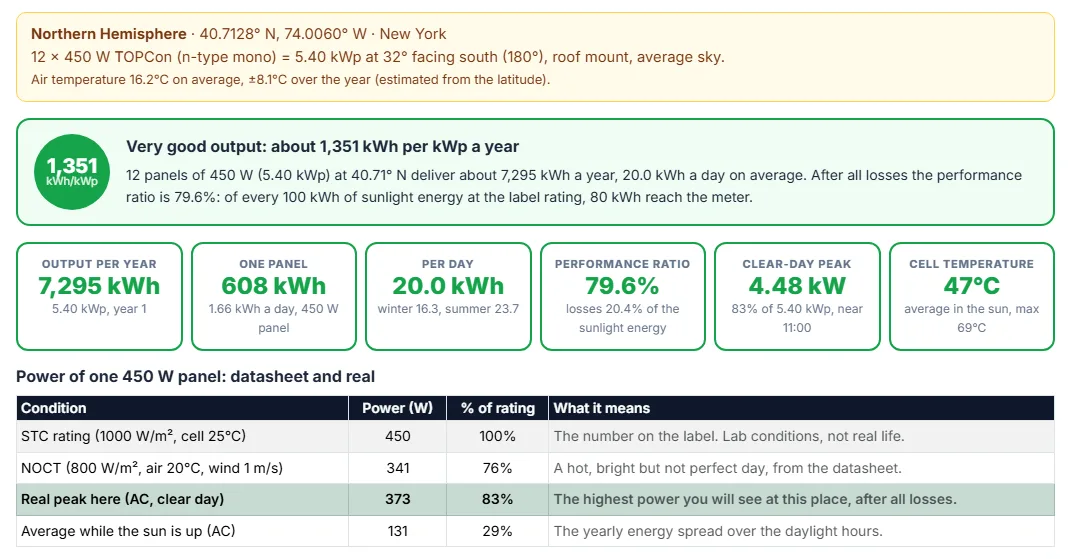
In New York, a 450 W TOPCon panel on a pitched roof at the best angle peaks at about 373 W on a clear day, which is 83% of its label, and makes about 608 kWh a year. A system of 12 of these panels (5.4 kWp) delivers about 7,295 kWh a year, with a performance ratio of 79.6%.
Output per Panel, per Day, per Month and per Year
The tool is a solar panel calculator on a map, so you calculate solar panel output by location: the sunlight, the air temperature and the best angle all come from the point you click. The results then give the output in every unit that matters. The yearly kWh of the system is the number to compare with your electricity bill and with an installer’s quote. The output of one panel answers the common question of how much electricity a solar panel produces. The kWh a day, in winter and in summer, is what counts for batteries and off-grid use. The specific yield in kWh per kWp lets you compare places and systems of any size.
A Free Solar Output Calculator with No Sign-Up
There is no account, no email and no phone number. The point you pick is used only to work out the sunlight and is not stored, and the PDF is made in your own browser. That makes it a neutral PV output calculator for checking a quote before you talk to anyone. It also works as a free solar panel simulator online: change the tilt, the inverter or the panel type, and the whole year is simulated again in about a second, so you can try many designs.
Who Uses a PV Output Calculator?
Home owners who want to know what their panels will really make. Owners of existing systems who want to check if their output is normal. Installers who need to explain the gap between the label and the meter to a customer. Engineers and students who want to see the effect of heat, the inverter size or the panel technology. For the number of panels that fit on a roof, use the Roof Solar Calculator. For a quick kWh figure by place, use the Solar Panel Energy Calculator, and for the best angle the Solar Panel Tilt Angle Calculator.
Key Features of This Solar Panel Output Calculator
- Any place on Earth: map click, address or zip code search, current location, or coordinates.
- Any panel rating from 10 to 1,000 W and up to 20,000 panels, with six technologies and their datasheet values.
- Best tilt or your own tilt and direction, and three mounting types with their own cell temperature.
- A climate estimate from the latitude, or your own yearly air temperature and seasonal swing.
- Every loss as a setting: soiling, shade, mismatch, DC wiring, LID, inverter efficiency, DC/AC ratio, AC wiring and availability.
- Output per year, per panel, per day and per month, the performance ratio, the clear-day peak power and the cell temperature.
- The datasheet (STC and NOCT) and real power of one panel side by side.
- Charts: loss waterfall, monthly output, power during the day, air and cell temperature, output over the years, technology comparison.
- Tables: loss chain, month by month, six technologies, six inverter sizes, output over the years and one panel of each size.
- A solar engineer review with next steps, a map popup with a Share on WhatsApp button, a copy link and a PDF report.
How to Use the Solar Panel Output Calculator: Step by Step
Click any place on the map, or type an address, a city or a zip code and press Search. You can also press My location, type a latitude and a longitude, or press one of the Try buttons. A red dot marks the place, a green arrow shows the direction the panels face, and a popup opens with the yearly kWh, the output of one panel and the performance ratio.
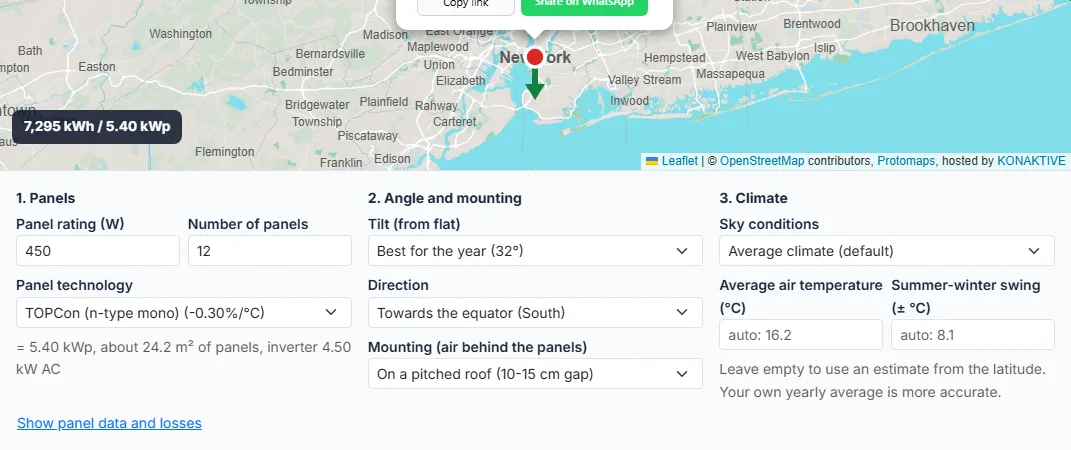
Type the rating of one panel in watts, from the label or the datasheet (450 W is the default), and the number of panels. Pick the technology: TOPCon, PERC, HJT, IBC, CdTe thin film or older polycrystalline. The tool fills in the typical temperature coefficient, NOCT, efficiency and degradation, and shows the system size in kWp, the panel area and the inverter size.
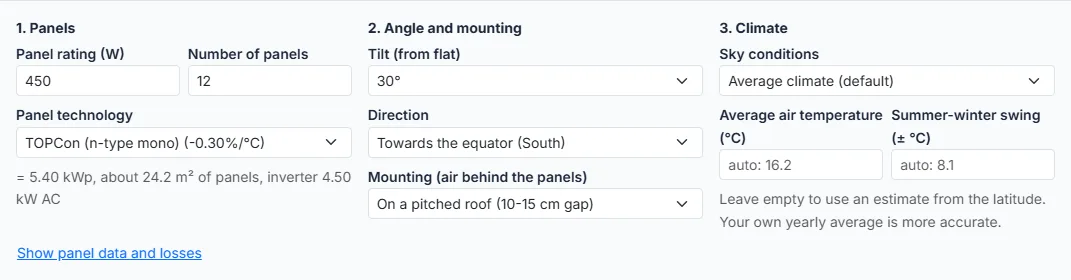
Leave the tilt on Best for the year and the direction on Towards the equator, or pick the real angle and compass direction of your roof. Choose the mounting: an open rack, a pitched roof with a small air gap, or panels built into the roof. Less air behind the panels means hotter cells and less output.
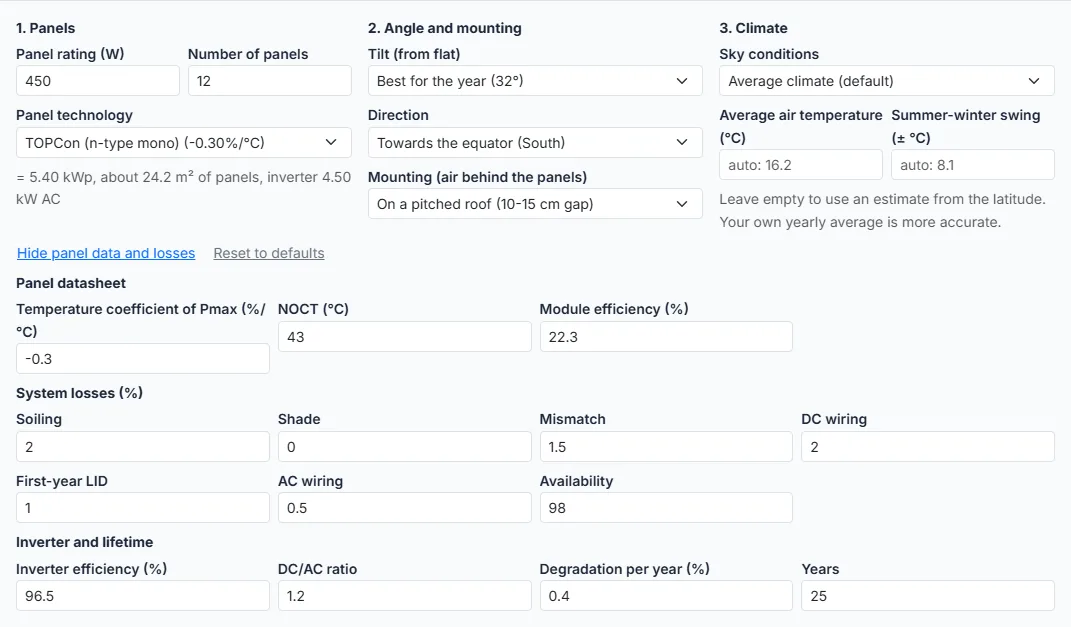
Pick sunny, average or cloudy. Leave the air temperature empty to use an estimate, or type the yearly average of your town. Open Show panel data and losses to type the datasheet values and every loss: soiling, shade, mismatch, wiring, LID, inverter efficiency, DC/AC ratio, availability, degradation and years.
The results show the yearly kWh, the output of one panel, the kWh a day, the performance ratio, the clear-day peak power and the cell temperature. Below are the datasheet and real power of one panel, the loss waterfall, the monthly chart, the power during the day, the temperature chart, the loss and month tables, the technology and inverter comparisons, the output over the years and a solar engineer review.
Press Download PDF report to save a report with a maplity.com letterhead, the charts, the tables and the review. Press Copy link, or Share on WhatsApp in the map popup, to send a link that opens the calculator with the same place and settings.
How Much Power Does a Solar Panel Produce?
Output of One Panel by Size and City
The table shows the average daily output of one panel after all losses, for common ratings in six climates. All panels are TOPCon on a pitched roof at the best tilt for the place, with the default losses of the calculator.
| Panel | Phoenix | Sydney | Singapore | New York | London | Oslo |
|---|---|---|---|---|---|---|
| 300 W | 1.54 | 1.16 | 1.24 | 1.11 | 0.77 | 0.68 |
| 350 W | 1.79 | 1.36 | 1.44 | 1.29 | 0.90 | 0.79 |
| 400 W | 2.05 | 1.55 | 1.65 | 1.48 | 1.03 | 0.90 |
| 450 W | 2.30 | 1.74 | 1.86 | 1.66 | 1.16 | 1.02 |
| 500 W | 2.56 | 1.94 | 2.06 | 1.85 | 1.29 | 1.13 |
| 550 W | 2.81 | 2.13 | 2.27 | 2.03 | 1.42 | 1.24 |
| 600 W | 3.07 | 2.32 | 2.47 | 2.22 | 1.55 | 1.36 |
A 400 W solar panel makes about 2.05 kWh a day in Phoenix but only 0.90 kWh in Oslo. The rating is the same; the sunlight is not. Multiply by 365 for the year: a 400 W panel makes about 540 kWh a year in New York.
Peak Sun Hours: The Link Between Watts and kWh
Peak sun hours are the daily sunlight on the panel, written as hours of full sun (1000 W/m²). A panel at the best angle in New York gets 4.65 peak sun hours a day over the year, in Phoenix 6.59 and in London 3.15. A 400 W panel would make 0.4 kW x 4.65 h = 1.86 kWh a day in New York if there were no losses. The real output is lower by the performance ratio. Together this gives the basic solar power calculation formula:
400 W panel in New York, one year: 0.4 x 4.65 x 0.796 x 365 = 540 kWh
How to Calculate Solar Panel Wattage for Your Home
To size a system, turn the formula around. Take the yearly electricity use from your bills and divide it by the specific yield of your place (the kWh that 1 kWp makes in a year, shown in the results). That gives the panel wattage you need. Then divide by the rating of one panel to get the number of panels.
New York, 10,000 kWh a year: 10,000 / 1,351 = 7.4 kWp = 17 panels of 450 W
The same home in Phoenix needs about 5.4 kWp and in London about 10.6 kWp. Check that the panels fit on the roof with the Roof Solar Calculator before you ask for quotes.
From STC Rating to Real Output: The Loss Chain
The Loss Chain for One System in New York
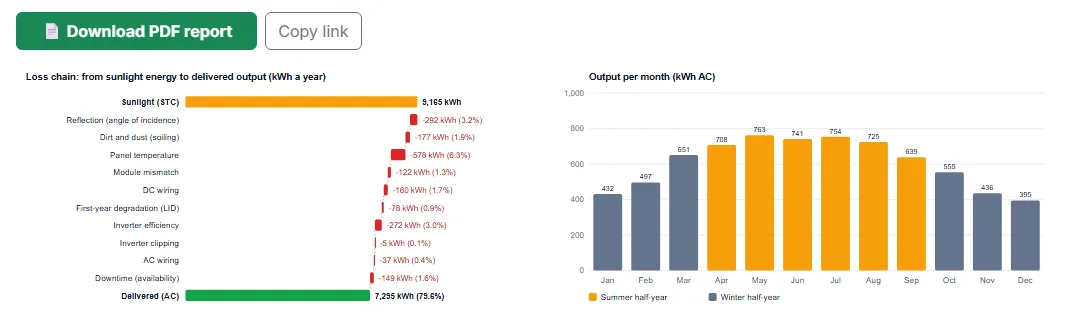
The example is 12 panels of 450 W TOPCon (5.4 kWp) in New York, at 32° facing true south on a pitched roof, with a 4.50 kW inverter (DC/AC ratio 1.2). The panels get 1,697 kWh of sunlight per m² a year, so at the label rating they would make 9,165 kWh. The chart and the table show what each step takes.
| Step | kWh a year | % of sunlight energy | What it is |
|---|---|---|---|
| Sunlight energy on the panels (STC) | 9,165 | 100% | kWp x sunlight on the panels: what the panels would make at their label rating. |
| Reflection (angle of incidence) | -292 | -3.2% | Light that hits the glass at a low angle is partly reflected away. |
| Dirt and dust (soiling) | -177 | -1.9% | Dust, pollen and bird droppings block light between rain showers. |
| Shade | 0 | 0.0% | Trees, chimneys and other rows that shade the panels. |
| Panel temperature | -578 | -6.3% | Hot cells make less power; cold cells make a little more. |
| Module mismatch | -122 | -1.3% | Panels in a string are never exactly equal, and the weakest sets the current. |
| DC wiring | -160 | -1.7% | Resistance of the cables from the panels to the inverter. |
| First-year degradation (LID) | -78 | -0.9% | New cells lose a little power in their first hours of sun. |
| Inverter efficiency | -272 | -3.0% | Turning DC into AC power costs a few percent as heat. |
| Inverter clipping | -5 | -0.1% | On bright days the DC power can be more than the inverter can deliver. |
| AC wiring | -37 | -0.4% | Cables from the inverter to the meter. |
| Downtime (availability) | -149 | -1.6% | Hours when the system is off: grid faults, repairs, updates. |
| Output delivered (AC) | 7,295 | 79.6% | What reaches your home or the grid in year 1. |
The Performance Ratio
The performance ratio (PR) is the delivered energy divided by the energy the panels would make at their label rating with the same sunlight. It is the share of the sunlight energy that survives all losses.
E_AC = delivered energy (kWh), kWp = panel rating, H_POA = sunlight on the panels (kWh/m²)
New York: 7,295 / (5.40 x 1,697) = 0.796
| Place | Air °C (year) | Cell °C in sun | Heat loss | Performance ratio | kWh per kWp |
|---|---|---|---|---|---|
| Oslo (cloudy) | 4.2 | 32 | 2.1% | 83.1% | 826 |
| London (cloudy) | 9.4 | 38 | 3.7% | 81.8% | 942 |
| New York (average) | 16.2 | 47 | 6.3% | 79.6% | 1,351 |
| Sydney (average) | 19.3 | 51 | 7.5% | 78.1% | 1,414 |
| Phoenix (sunny) | 22.0 | 55 | 8.6% | 77.7% | 1,869 |
| Singapore (average) | 28.3 | 61 | 10.3% | 75.7% | 1,506 |
The PR is highest in cool places, because the panels run close to 25°C, and lowest in hot places. That is why a sunny, hot place does not make as much more energy as its sunlight alone would suggest.
Panel Temperature: The Largest Loss You Can Control
How Hot a Solar Cell Gets: the NOCT Model
A solar cell is heated by the light it does not turn into power. The datasheet gives the NOCT (nominal operating cell temperature): the cell temperature at 800 W/m², 20°C air and 1 m/s of wind on an open rack. From it, the cell temperature at any moment is:
G = sunlight on the panel (W/m²). A pitched-roof mount adds about 8°C to the NOCT, an in-roof mount about 18°C.
Example: a bright moment with 900 W/m² on a TOPCon panel (NOCT 43°C) on a pitched roof (51°C with the mount), with the air at 30°C. The cell is at 30 + (51 - 20) / 800 x 900 = 64.9°C.
The Temperature Coefficient of Pmax
The temperature coefficient of Pmax says how much power the panel loses for each °C above 25°C. For the example cell at 64.9°C with a coefficient of -0.30%/°C:
= P_STC x [1 + (-0.0030) x (64.9 - 25)] = P_STC x 0.880
The panel makes 12.0% less than its rating at that moment, from heat alone.
| Technology | Temp. coeff. (%/°C) | NOCT (°C) | Efficiency | Degradation a year | Heat loss New York | Heat loss Phoenix |
|---|---|---|---|---|---|---|
| TOPCon (n-type mono) | -0.30 | 43 | 22.3% | 0.40% | 6.3% | 8.6% |
| PERC (p-type mono) | -0.35 | 45 | 21.3% | 0.55% | 7.9% | 10.7% |
| HJT (heterojunction) | -0.26 | 43 | 22.5% | 0.25% | 5.5% | 7.5% |
| IBC (back contact) | -0.29 | 43 | 23.0% | 0.25% | 6.1% | 8.3% |
| CdTe thin film | -0.28 | 45 | 19.0% | 0.30% | 6.3% | 8.6% |
| Polycrystalline (older) | -0.40 | 46 | 17.5% | 0.70% | 9.4% | 12.6% |
Mounting and Air Gap
Air behind the panel carries heat away. The same panel runs cooler on an open frame than on a roof, and hottest when it is built into the roof with no air gap.
| Mounting | NOCT added | New York kWh | New York heat loss | Phoenix kWh | Phoenix heat loss |
|---|---|---|---|---|---|
| Open rack (ground or flat roof frame) | +0°C | 7,436 | 4.3% | 10,319 | 6.4% |
| On a pitched roof (10-15 cm gap) | +8°C | 7,295 | 6.3% | 10,093 | 8.6% |
| In the roof (little or no air gap) | +18°C | 7,095 | 8.8% | 9,776 | 11.4% |
Air and cell temperature by month in Phoenix, pitched-roof mount. The cells run 30 to 50°C above the air on bright days.
Reflection and the Angle of Incidence
Why Low Sun Makes Less Power
Glass reflects more light when the light arrives at a low angle. The calculator uses the ASHRAE incidence angle modifier (IAM) for the direct beam, and a fixed 0.94 for sky and ground light:
theta = 0°: 1.000 30°: 0.992 50°: 0.972 60°: 0.950 70°: 0.904 80°: 0.762
Over a year this costs about 3.2% in New York. Panels that face away from the equator, or stand steep, lose more, because more of their light arrives at a low angle.
Inverter Efficiency, DC/AC Ratio and Clipping
What the DC/AC Ratio Means
The DC/AC ratio is the panel rating divided by the inverter AC rating. A 5.4 kWp array on a 4.50 kW inverter has a ratio of 1.2. Because the panels rarely reach their rating, installers often use a ratio of 1.1 to 1.3: the inverter is smaller and cheaper, and it works in a more efficient part of its curve for most of the day. The cost is clipping: on the brightest hours the extra DC power is cut off.
Clipping Loss by DC/AC Ratio
| DC/AC ratio | Inverter (kW AC) | New York kWh | New York clipping | Phoenix kWh | Phoenix clipping |
|---|---|---|---|---|---|
| 1.0 | 5.40 | 7,300 | 0.00% | 10,098 | 0.00% |
| 1.1 | 4.91 | 7,300 | 0.00% | 10,098 | 0.00% |
| 1.2 | 4.50 | 7,295 | 0.05% | 10,093 | 0.04% |
| 1.3 | 4.15 | 7,215 | 0.95% | 9,981 | 0.92% |
| 1.4 | 3.86 | 7,081 | 2.45% | 9,763 | 2.64% |
| 1.5 | 3.60 | 6,915 | 4.30% | 9,499 | 4.73% |
Power during the day in New York with a DC/AC ratio of 1.3 (4.15 kW inverter). On clear days in May the curve reaches the inverter limit and goes flat around noon; on average days and in winter it stays below.
Inverter Efficiency
Modern string inverters turn 96 to 98.5% of the DC power into AC power. Use the weighted efficiency from the datasheet (CEC in the USA, European efficiency in Europe), because it reflects real part-load operation better than the peak value.
Solar Panel Output Voltage
A panel’s power is its voltage times its current. The datasheet gives two voltages: the open-circuit voltage (Voc), with nothing connected, and the voltage at maximum power (Vmp), where the panel works in normal use. A 400 to 450 W panel with 108 half-cut cells has a Voc of about 37 to 42 V and a Vmp of about 31 to 35 V. Large 144-cell panels of 550 to 600 W reach about 49 to 53 V Voc.
Panels in a string are wired in series, so their voltages add up. The voltage also changes with temperature, the opposite way to the current: it falls on hot days and rises on cold mornings, by about 0.25 to 0.30% per °C. The string must stay below the inverter’s maximum input voltage on the coldest morning of the year.
12 panels of 40 V at -10°C, beta = -0.27%/°C: 12 x 40 x [1 + 0.0027 x 35] = 525 V
The output voltage does not change the yearly kWh as long as the string stays inside the inverter’s voltage window, so this calculator works with power and energy. Your installer checks the string voltage with the inverter maker’s sizing tool.
Degradation: Output Over 25 Years
First-Year LID and Yearly Degradation
New panels lose a small part of their power in the first days of sun. This is light-induced degradation (LID): about 1 to 2% for p-type PERC and 0.5 to 1% for n-type cells. After that the power falls slowly, by about 0.25 to 0.7% a year depending on the technology. The calculator applies LID to year 1 and the yearly rate after that.
| Technology | LID | Degradation a year | Year 1 (kWh) | Year 25 (kWh) | Year 25 / year 1 |
|---|---|---|---|---|---|
| TOPCon (n-type mono) | 1.0% | 0.40% | 7,295 | 6,626 | 90.8% |
| PERC (p-type mono) | 2.0% | 0.55% | 7,093 | 6,214 | 87.6% |
| HJT (heterojunction) | 0.5% | 0.25% | 7,389 | 6,958 | 94.2% |
| IBC (back contact) | 1.0% | 0.25% | 7,311 | 6,885 | 94.2% |
| CdTe thin film | 1.0% | 0.30% | 7,292 | 6,784 | 93.0% |
| Polycrystalline (older) | 2.0% | 0.70% | 6,974 | 5,892 | 84.5% |
Over 25 years the 5.4 kWp TOPCon system in New York delivers about 173,888 kWh in total. Check the linear power warranty of the panels: most promise 80 to 90% of the rating after 25 to 30 years.
Power During the Day and Peak Power
Clear Day and Average Day
An average day mixes clear and cloudy weather. Its midday power is lower than a clear day’s, and it never shows the real peak. That is why the calculator splits each month into clear days and overcast days, weighted so the month keeps the sunlight of the chosen sky setting. The clear-day peak in New York is about 4.48 kW for 5.4 kWp, close to 11:00 solar time.
East and West Panels
Panels facing east at 30° in New York make about 5,996 kWh a year, 18% less than the best angle, but their power comes earlier in the day and they clip less. East-west systems are common on flat roofs, because the rows can stand close together.
Solar Panel Output by City
How to Read the City Tables
Each row is the same system (12 panels of 450 W TOPCon, 5.4 kWp) at the best tilt for the city, on a pitched roof, with the default losses and a climate estimate from the latitude. Click the city on the map above to set your own panels. If you need a solar calculator for Europe, the European table runs from Lisbon and Madrid in the sunny south to the cloudier north, and any other European town is one click away on the map.
Solar Panel Output in USA
| City | Region | Latitude | Sky | kWh per kWp a year | Performance ratio | Heat loss | Cell °C in sun | 400 W panel, kWh a day | 5.4 kWp, kWh a year |
|---|---|---|---|---|---|---|---|---|---|
| New York | NY | 40.71° N | Average | 1,351 | 79.6% | 6.3% | 47 | 1.48 | 7,295 |
| Los Angeles | CA | 34.05° N | Sunny | 1,864 | 77.8% | 8.5% | 55 | 2.04 | 10,064 |
| Chicago | IL | 41.88° N | Average | 1,340 | 79.8% | 6.1% | 46 | 1.47 | 7,235 |
| Houston | TX | 29.76° N | Average | 1,442 | 78.1% | 7.9% | 53 | 1.58 | 7,785 |
| Phoenix | AZ | 33.45° N | Sunny | 1,869 | 77.7% | 8.6% | 55 | 2.05 | 10,093 |
| Philadelphia | PA | 39.95° N | Average | 1,358 | 79.5% | 6.4% | 48 | 1.49 | 7,335 |
| San Antonio | TX | 29.42° N | Sunny | 1,900 | 77.1% | 9.2% | 57 | 2.08 | 10,259 |
| San Diego | CA | 32.72° N | Sunny | 1,874 | 77.6% | 8.7% | 56 | 2.05 | 10,119 |
| Dallas | TX | 32.78° N | Average | 1,420 | 78.5% | 7.5% | 51 | 1.56 | 7,670 |
| San Jose | CA | 37.34° N | Sunny | 1,830 | 78.2% | 8.0% | 53 | 2.00 | 9,884 |
| Austin | TX | 30.27° N | Average | 1,438 | 78.1% | 7.8% | 53 | 1.57 | 7,766 |
| Jacksonville | FL | 30.33° N | Average | 1,438 | 78.1% | 7.8% | 53 | 1.57 | 7,763 |
| San Francisco | CA | 37.77° N | Average | 1,379 | 79.2% | 6.8% | 49 | 1.51 | 7,449 |
| Columbus | OH | 39.96° N | Average | 1,358 | 79.5% | 6.4% | 48 | 1.49 | 7,334 |
| Indianapolis | IN | 39.77° N | Average | 1,360 | 79.5% | 6.5% | 48 | 1.49 | 7,345 |
| Fort Worth | TX | 32.76° N | Average | 1,421 | 78.5% | 7.5% | 51 | 1.56 | 7,671 |
| Charlotte | NC | 35.23° N | Average | 1,402 | 78.8% | 7.2% | 50 | 1.54 | 7,572 |
| Seattle | WA | 47.61° N | Cloudy | 989 | 81.2% | 4.4% | 40 | 1.08 | 5,339 |
| Denver | CO | 39.74° N | Sunny | 1,803 | 78.6% | 7.6% | 52 | 1.97 | 9,737 |
| Washington | DC | 38.91° N | Average | 1,369 | 79.3% | 6.6% | 48 | 1.50 | 7,392 |
Solar Panel Output in Europe
| City | Region | Latitude | Sky | kWh per kWp a year | Performance ratio | Heat loss | Cell °C in sun | 400 W panel, kWh a day | 5.4 kWp, kWh a year |
|---|---|---|---|---|---|---|---|---|---|
| London | United Kingdom | 51.51° N | Cloudy | 942 | 81.8% | 3.7% | 38 | 1.03 | 5,087 |
| Paris | France | 48.86° N | Average | 1,253 | 80.9% | 4.9% | 42 | 1.37 | 6,767 |
| Berlin | Germany | 52.52° N | Cloudy | 928 | 81.9% | 3.5% | 37 | 1.02 | 5,014 |
| Madrid | Spain | 40.42° N | Sunny | 1,795 | 78.7% | 7.5% | 51 | 1.97 | 9,693 |
| Rome | Italy | 41.90° N | Sunny | 1,778 | 79.0% | 7.3% | 50 | 1.95 | 9,603 |
| Barcelona | Spain | 41.39° N | Sunny | 1,783 | 78.9% | 7.4% | 51 | 1.95 | 9,626 |
| Vienna | Austria | 48.21° N | Average | 1,262 | 80.8% | 5.0% | 43 | 1.38 | 6,814 |
| Amsterdam | Netherlands | 52.37° N | Cloudy | 931 | 81.9% | 3.5% | 37 | 1.02 | 5,025 |
| Brussels | Belgium | 50.85° N | Cloudy | 950 | 81.7% | 3.8% | 38 | 1.04 | 5,130 |
| Lisbon | Portugal | 38.72° N | Sunny | 1,815 | 78.5% | 7.8% | 52 | 1.99 | 9,801 |
| Athens | Greece | 37.98° N | Sunny | 1,823 | 78.3% | 7.9% | 53 | 2.00 | 9,846 |
| Dublin | Ireland | 53.35° N | Cloudy | 918 | 82.1% | 3.3% | 37 | 1.01 | 4,957 |
| Stockholm | Sweden | 59.33° N | Cloudy | 835 | 83.1% | 2.2% | 33 | 0.91 | 4,507 |
| Oslo | Norway | 59.91° N | Cloudy | 826 | 83.1% | 2.1% | 32 | 0.90 | 4,460 |
| Copenhagen | Denmark | 55.68° N | Cloudy | 887 | 82.5% | 2.9% | 35 | 0.97 | 4,788 |
| Helsinki | Finland | 60.17° N | Cloudy | 823 | 83.2% | 2.1% | 32 | 0.90 | 4,443 |
| Warsaw | Poland | 52.23° N | Cloudy | 932 | 81.9% | 3.5% | 37 | 1.02 | 5,035 |
| Prague | Czechia | 50.08° N | Average | 1,236 | 81.1% | 4.7% | 41 | 1.35 | 6,675 |
| Budapest | Hungary | 47.50° N | Average | 1,272 | 80.7% | 5.1% | 43 | 1.39 | 6,870 |
| Munich | Germany | 48.14° N | Average | 1,263 | 80.8% | 5.0% | 43 | 1.38 | 6,820 |
Solar Panel Output in Australia
| City | Region | Latitude | Sky | kWh per kWp a year | Performance ratio | Heat loss | Cell °C in sun | 400 W panel, kWh a day | 5.4 kWp, kWh a year |
|---|---|---|---|---|---|---|---|---|---|
| Sydney | NSW | 33.87° S | Average | 1,414 | 78.1% | 7.5% | 51 | 1.55 | 7,636 |
| Melbourne | VIC | 37.81° S | Average | 1,381 | 78.7% | 7.0% | 49 | 1.51 | 7,459 |
| Brisbane | QLD | 27.47° S | Sunny | 1,914 | 76.6% | 9.6% | 59 | 2.10 | 10,334 |
| Perth | WA | 31.95° S | Sunny | 1,882 | 77.1% | 9.0% | 57 | 2.06 | 10,164 |
| Adelaide | SA | 34.93° S | Sunny | 1,858 | 77.5% | 8.6% | 55 | 2.03 | 10,033 |
| Canberra | ACT | 35.28° S | Sunny | 1,854 | 77.6% | 8.5% | 55 | 2.03 | 10,014 |
| Hobart | TAS | 42.88° S | Cloudy | 1,042 | 79.9% | 5.4% | 44 | 1.14 | 5,625 |
| Darwin | NT | 12.46° S | Sunny | 1,970 | 75.2% | 11.1% | 64 | 2.16 | 10,639 |
| Gold Coast | QLD | 28.02° S | Sunny | 1,910 | 76.6% | 9.5% | 58 | 2.09 | 10,315 |
| Newcastle | NSW | 32.93° S | Average | 1,421 | 78.0% | 7.6% | 52 | 1.56 | 7,675 |
Solar Panel Output in United Kingdom
| City | Region | Latitude | Sky | kWh per kWp a year | Performance ratio | Heat loss | Cell °C in sun | 400 W panel, kWh a day | 5.4 kWp, kWh a year |
|---|---|---|---|---|---|---|---|---|---|
| London | England | 51.51° N | Cloudy | 942 | 81.8% | 3.7% | 38 | 1.03 | 5,087 |
| Birmingham | England | 52.49° N | Cloudy | 929 | 81.9% | 3.5% | 37 | 1.02 | 5,016 |
| Manchester | England | 53.48° N | Cloudy | 916 | 82.1% | 3.3% | 37 | 1.00 | 4,947 |
| Liverpool | England | 53.41° N | Cloudy | 917 | 82.1% | 3.3% | 37 | 1.00 | 4,953 |
| Bristol | England | 51.45° N | Cloudy | 943 | 81.8% | 3.7% | 38 | 1.03 | 5,091 |
| Leeds | England | 53.80° N | Cloudy | 912 | 82.2% | 3.3% | 36 | 1.00 | 4,927 |
| Glasgow | Scotland | 55.86° N | Cloudy | 884 | 82.5% | 2.9% | 35 | 0.97 | 4,774 |
| Edinburgh | Scotland | 55.95° N | Cloudy | 883 | 82.5% | 2.9% | 35 | 0.97 | 4,766 |
| Cardiff | Wales | 51.48° N | Cloudy | 942 | 81.8% | 3.7% | 38 | 1.03 | 5,089 |
| Belfast | Northern Ireland | 54.60° N | Cloudy | 901 | 82.3% | 3.1% | 36 | 0.99 | 4,867 |
How the Solar Panel Output Calculator Works
The Sunlight Model
- For the average day of each month it finds the sun declination, the day length and the sunlight above the atmosphere (Duffie and Beckman).
- It lowers that light with a clear-sky atmosphere (Hottel, 1976) and a cloud factor from the sky setting.
- It splits the month into clear days and overcast days (20% of a clear day), weighted so the month keeps the same sunlight.
- For each day type it splits the light into direct and diffuse (Erbs, Klein and Duffie, 1982) and spreads it over 144 steps of the day (Collares-Pereira and Rabl, 1979).
- At each step it finds the angle of the sun on the panel, and the direct, sky and ground light on the tilted panel (Liu and Jordan, 1963, with 20% ground reflection).
The Output Model
- Reflection: ASHRAE incidence angle modifier with b0 = 0.05 for direct light, 0.94 for sky and ground light.
- Soiling and shade, as set.
- Cell temperature from the NOCT model, with the mounting added to the NOCT, and air temperature from the yearly mean, a seasonal swing and a daily swing of ±5°C.
- Power change from the temperature coefficient of Pmax.
- Mismatch, DC wiring and first-year LID.
- Inverter efficiency, then clipping at the inverter AC rating.
- AC wiring and availability.
- Later years: yearly degradation after year 1.
Every step keeps the energy it removes, so the loss chain always adds up to the delivered output.
Accuracy and Limits
For a well-built system the estimate is usually within about 10% of PVWatts and PVGIS, which use measured weather years. The model does not see local shade, snow cover, the real weather of a given year or the exact climate of a valley or a coast. The air temperature estimate from the latitude is rough: type the real yearly average of your town for a better temperature loss. For a purchase, ask for an installer’s site survey.
Glossary of Solar Output Terms
Terms Used in the Results
- STC (standard test conditions)
- 1000 W/m² of light, a cell at 25°C and an air mass of 1.5. The label rating of a panel is measured at STC.
- NOCT / NMOT
- Cell temperature at 800 W/m², 20°C air and 1 m/s wind. Used to estimate the real cell temperature.
- Temperature coefficient of Pmax
- Change of power for each °C of cell temperature away from 25°C, in %/°C.
- POA irradiance
- Sunlight on the plane of the panels, in W/m² at a moment or kWh/m² over a day or a year.
- Peak sun hours
- The daily POA sunlight written as hours of 1000 W/m².
- Performance ratio (PR)
- Delivered AC energy divided by kWp x POA sunlight. The share of the sunlight energy that survives all losses.
- Specific yield
- Yearly energy per kWp of panels, in kWh/kWp.
- Capacity factor
- Yearly energy divided by the energy of the panels at full rating all year (8,766 hours).
- IAM
- Incidence angle modifier: the share of light that enters the glass at a given angle.
- LID
- Light-induced degradation: the small power loss of new cells in their first days of sun.
- Voc and Vmp
- Open-circuit voltage and voltage at maximum power of a panel, from the datasheet. They set how many panels fit in one string.
- DC/AC ratio
- Panel rating (DC) divided by the inverter AC rating.
- Clipping
- DC power above what the inverter can deliver as AC. It is cut off and lost.