Free Solar Power Calculator: What It Tells You About Your Location
What a Solar Energy Calculator by Location Tells You
A solar panel energy calculator by location answers one question: how many kWh will solar panels make at this place? The same 5 kW system makes about 4,330 kWh a year in London and about 9,585 kWh a year in Phoenix, because the sunlight is very different. This tool finds the sunlight for the exact point you pick, month by month, and turns it into energy. It is a solar kWh calculator, a solar panel kWh per year calculator and a monthly solar production calculator in one page. It runs in your browser on phones, tablets and computers, so there is nothing to install.
Click a Point, Search an Address or a Zip Code
You can pick the place in four ways. Click anywhere on the map. Type a street address, a town or a postcode, so it works as a solar production calculator by address and a solar calculator by zip code. Press My location to use your phone or computer position. Or type a latitude and a longitude. Solar energy depends mainly on the latitude and the climate, so two houses in the same street get the same kWh per kWp. What changes between them is the roof: its size, angle, direction and shade.
Free Solar Power Calculator kWh Results: per Year, per Month and per Day
The result shows the energy in every useful unit. The yearly kWh is what you compare with your electricity bill. The monthly kWh shows the summer surplus and the winter gap. The daily kWh is what matters for a battery or an off-grid cabin. The kWh per kWp by location (the specific yield) lets you compare places and quotes: it is the yearly energy of each kW of panels, so it does not depend on the size of the system. This makes the page an annual solar energy calculator and a solar panel yield calculator as well.
Peak Sun Hours and Solar Irradiance by Location
Behind the kWh there are two sunlight numbers, and the tool shows both. The first is the sunlight on flat ground, in kWh per square metre per day. This is the solar irradiance by location (strictly, the daily irradiation or solar insolation by location) that solar maps show. The second is the sunlight on the tilted panels. Written as hours of full sun, it is the peak sun hours by location, the number installers use to size a system. A tilted panel facing the equator gets more light than flat ground, most of all in winter and far from the equator.
A Free Solar Calculator with No Sign-Up
Many online solar calculators ask for your name, email and phone number before they show a result, because they pass your details to installers. This is a solar calculator without personal information. There is no account, no form and no sales call: pick a place and the kWh appear at once. The point you pick is used only to work out the sunlight and is not stored, and the PDF is made in your own browser. That makes it a neutral calculator solar panel buyers can use to check a quote before they talk to anyone.
Who Uses a Solar Power Generation Calculator?
Home owners who want a solar panel calculator for home use, to know if solar is worth it before they call an installer. Installers and sales teams who need a fast first number for a customer in another town. Students and teachers who learn how latitude and climate change the solar potential by location. Engineers who check a quote or a design. People who plan a camper, a boat, a cabin or a remote pump and need the daily kWh in winter. For the panels that fit on one roof, use the Roof Solar Calculator. For the best angle in detail, use the Solar Panel Tilt Angle Calculator.
Key Features of This Solar Energy Production Calculator
- A free solar energy production calculator for any place on Earth: map click, address or zip code search, current location, or coordinates.
- Any system size from 0.1 kW to 10,000 kW, and panels from 300 W to 550 W, with the number of panels and the panel area.
- Best fixed tilt for the year, or your own tilt from 0° to 90° and any of 8 compass directions.
- Yearly kWh, kWh per kWp, kWh per day, kWh per month, peak sun hours and capacity factor.
- Winter, summer and whole-year averages, per system, per kWp and per square metre of panel.
- Charts: monthly energy with your use line, daily energy by month, and sunlight on flat ground against sunlight on the panels.
- A heat map of the yearly energy for 6 tilts and 8 directions, as a percent of the best.
- A month table with daylight hours, sunlight and energy, a table by system size and a table for one panel of each size.
- A solar expert review: site and sunlight, seasons, tilt and direction, energy, your use, value and carbon, and next steps.
- A popup on the map pin with the key numbers, and a Share on WhatsApp button. The message includes the kWh and a link to the result.
- A PDF report with a maplity.com letterhead, and a link that keeps your location and settings.
- Tables of peak sun hours and kWh per kWp for 100 US cities, 100 European cities, 10 Australian cities and 10 UK cities.
How to Use the Solar Panel Energy Calculator: Step by Step
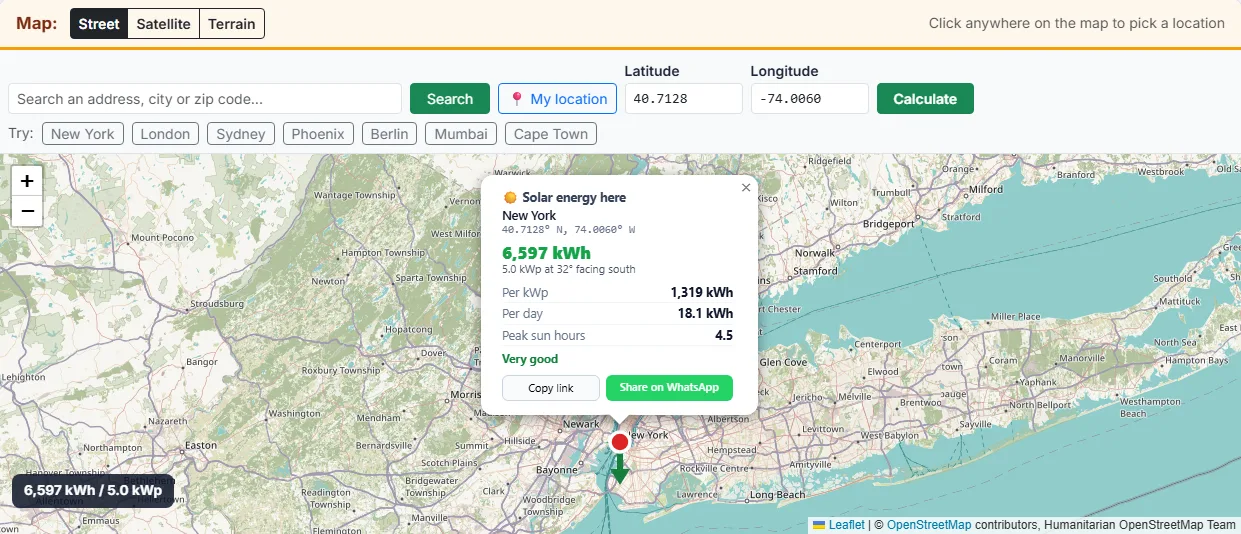
Click any place on the map, or type an address, a city or a zip code in the search box and press Search. You can also press My location, or type a latitude and a longitude and press Calculate. The Try buttons load example cities. A red dot marks the place and a green arrow shows the direction the panels face. A popup opens on the pin with the kWh per year, per kWp and per day, and the peak sun hours. Click the pin to open it again.
Type the system size in kW (5 kW is the default, a common home size). Pick the panel size, from 300 W to 550 W. The tool shows how many panels that is and how many square metres of panels you need.
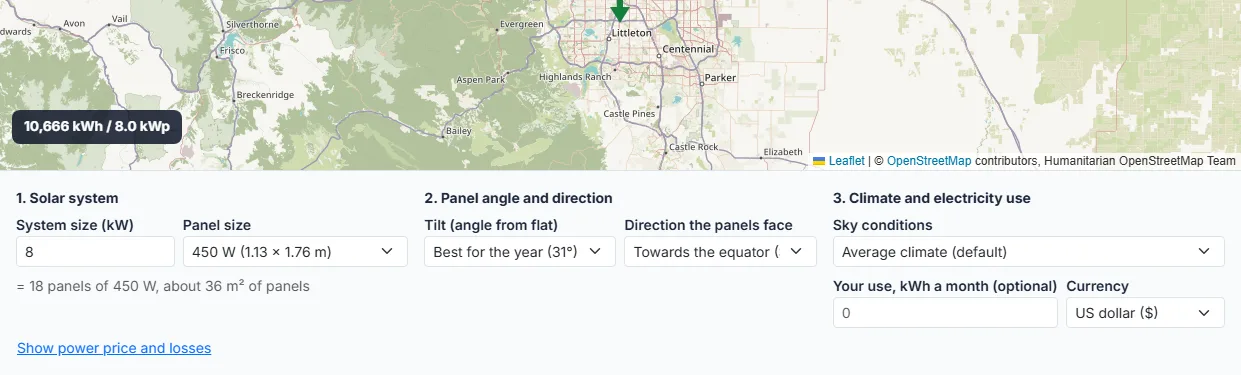
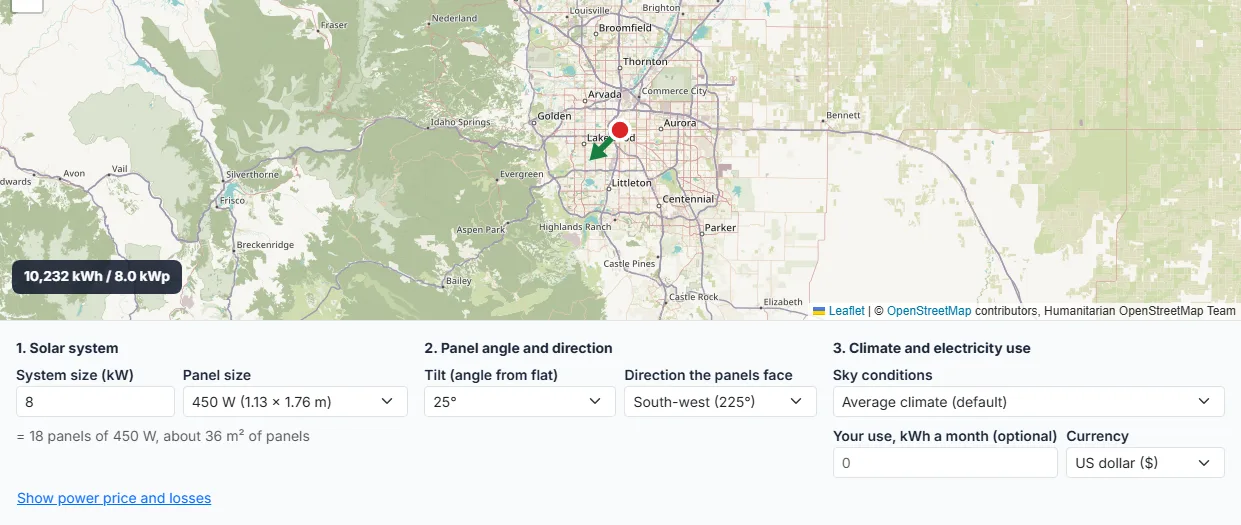
Leave the tilt on Best for the year and the direction on Towards the equator to get the best fixed angle for the place. To match a real roof, pick its angle from flat (0°) to a wall (90°), and its compass direction. Every change updates the kWh at once.
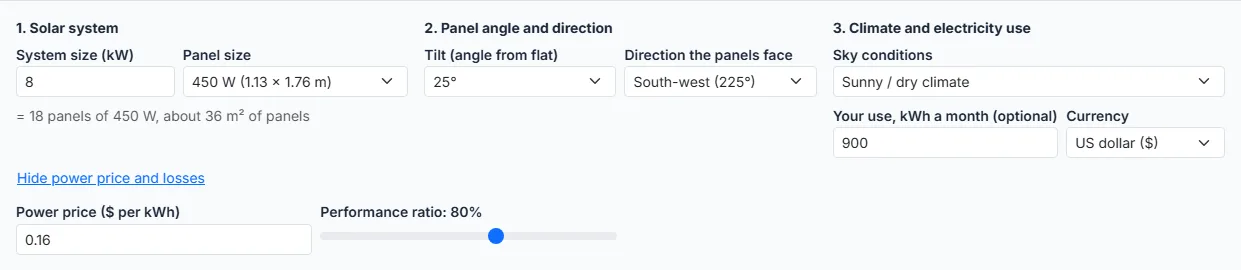
Pick sunny, average or cloudy for the climate of the place. Type your monthly electricity use to see the share that solar covers. Open Show power price and losses to set the price per kWh and the performance ratio.
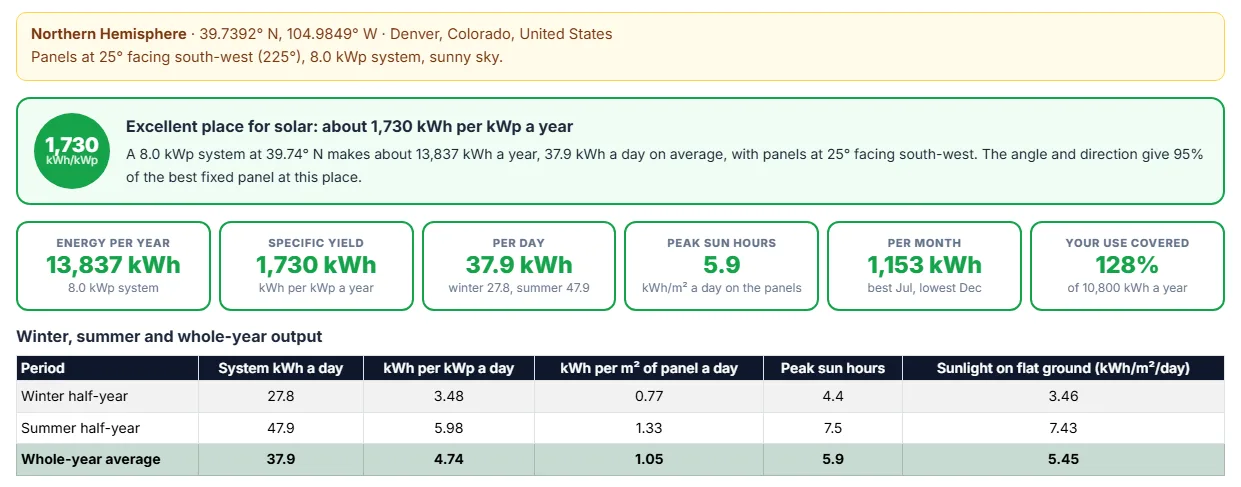
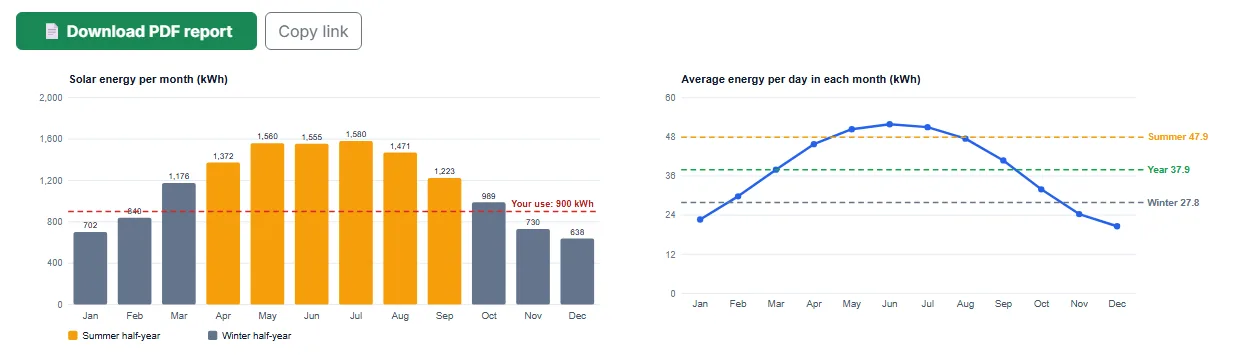
The rating and the kWh per kWp are at the top, then the energy per year, per day and per month, and the peak sun hours. Below are the winter and summer table, the monthly and daily charts, the sunlight chart, the heat map of tilt and direction, the month table, the size table, the panel table and the solar expert review.
Press Download PDF report to save a study with a maplity.com letterhead, the charts, the tables and the review. To share, press Share on WhatsApp in the map popup: the message has the kWh of the place and a link that opens this calculator with the same location and settings. Copy link does the same for email or any other app.
How the Solar Energy Calculator by Location Works
The Worked Example Uses One System
This section follows the numbers from the map click to the kWh, so you can check them by hand. The example is a 5 kW system (13 panels of 400 W) in New York at 40.71° N, with an average sky, panels at the best tilt of 32° facing true south, and a performance ratio of 80 percent.
The Sunlight Model, Step by Step
For the average day of every month the tool does this:
- It finds the sun declination, the day length and the sunlight above the atmosphere from the latitude.
- It lowers that light with a clear-sky atmosphere model, then with a cloud factor from the sky setting (sunny, average or cloudy).
- It splits the daily light into direct beam and diffuse sky light, and spreads both over the hours of the day.
- For every hour it works out how directly the sun hits the panel, from the panel tilt and compass direction, and adds diffuse light and light reflected from the ground.
- It adds the hours to get the sunlight on the panel in kWh per square metre per day. This number is the peak sun hours for the month.
From Peak Sun Hours to kWh: The Formula
The energy of one month is:
The system size in kWp is the power of the panels in standard test light (1 kW per square metre at 25°C). One peak sun hour on 1 kWp of panels gives 1 kWh before losses. The performance ratio takes off the losses between the light on the panels and the power you can use.
Performance Ratio and System Losses
The performance ratio is 80 percent by default. You can set it from 65 to 90 percent under Show power price and losses. It covers these losses:
| Loss | Typical size | What causes it |
|---|---|---|
| Panel temperature | 4 to 8% | Silicon panels lose about 0.35% of power for each degree Celsius above 25°C. Hot climates and panels with little air behind them lose more. |
| Inverter | 2 to 4% | Turning direct current into alternating current is 96 to 98% efficient. |
| Wiring and connections | 1 to 2% | Cable resistance and connectors. |
| Dirt, dust and snow | 1 to 4% | Rain cleans tilted panels. Dry, dusty places and low tilts lose more. |
| Mismatch and ageing | 1 to 3% | Small differences between panels, and a slow yearly decline of about 0.5%. |
Worked Energy Example: 5 kW in New York
At the best tilt the panels get 4.52 peak sun hours a day on average, while flat ground gets 4.06 kWh per square metre a day. The yearly energy is 5 x 4.52 x 0.8 x 365.25 = 6,597 kWh. That is 1,319 kWh per kWp, 18.1 kWh a day and 550 kWh a month on average. The capacity factor, the energy as a share of running at full power all year, is 15.1 percent.
How to Calculate Solar Panels: The Formulas
The Calculation for Solar Panels in Three Lines
Every calculation for solar panels uses the same three numbers: the size of the system in kW, the peak sun hours of the place, and the performance ratio. You can go from the size to the energy, or from the energy you need back to the size.
- Energy a day (kWh) = system size (kW) x peak sun hours x performance ratio
- System size (kW) = energy a day (kWh) / (peak sun hours x performance ratio)
- Number of panels = system size (kW) x 1000 / panel power (W), rounded up
The calculator above does the first line for every month, with peak sun hours that fit your place, tilt and direction. The two sections below show the other two lines with real numbers.
Solar Load Calculation Formula
To size a system from what you use, start with the load. The solar load calculation formula adds up each appliance: watts x hours a day x how many. Divide the total by 1,000 to get kWh a day. Here is a small home with the common loads:
| Appliance | Watts | Hours a day | How many | Wh a day |
|---|---|---|---|---|
| LED lights | 10 | 5 | 8 | 400 |
| Fridge-freezer (runs about 8 of 24 hours) | 150 | 8 | 1 | 1,200 |
| Television | 100 | 4 | 1 | 400 |
| Laptop | 60 | 6 | 2 | 720 |
| Washing machine | 500 | 1 | 1 | 500 |
| Wi-Fi router | 10 | 24 | 1 | 240 |
| Phone chargers | 10 | 3 | 3 | 90 |
| Daily load | total | 3,550 Wh = 3.55 kWh | ||
From the Load to the System Size: A Worked Example
In New York the panels at the best tilt get 4.5 peak sun hours a day over the year and 3.5 in the winter half-year. With a performance ratio of 0.8, the system size for this load is 3.55 / (4.5 x 0.8) = 0.98 kW for a grid-connected home that balances over the year. An off-grid home must cover the short winter days too, so it needs 3.55 / (3.5 x 0.8) = 1.28 kW, plus a battery for the night. With 400 W panels that is 3 or 4 panels. Pick your own place in the calculator to get its peak sun hours, then use the same formula.
Example Charts: Solar Energy Month by Month
Example 1: Monthly Energy of 5 kW in New York
The tool draws this chart for any place you pick. Orange bars are the summer half-year and grey bars the winter half-year.
Example 2: Daily Energy in London and in Phoenix
The same 5 kW system in two climates. In London the winter days give far less. In Phoenix the curve is flatter and higher.
Example 3: Sunlight on Flat Ground and on the Panels in Sydney
Sydney is in the Southern Hemisphere, so the panels face north and winter is from April to September. The tilted panels get more light than flat ground in winter, when the sun is low, and a little less in summer.
How Much Energy Does a Solar Panel Produce?
Energy of One Panel by Size and City
A panel makes energy in proportion to its power rating, so a 500 W panel makes 25 percent more than a 400 W panel at the same place. The table gives the year-average kWh per day for one panel at the best tilt, with an 80 percent performance ratio.
| Panel | Phoenix, USA (sunny) kWh/day | Sydney, Australia (average) kWh/day | New York, USA (average) kWh/day | London, UK (cloudy) kWh/day |
|---|---|---|---|---|
| 300 W | 1.57 | 1.17 | 1.08 | 0.71 |
| 400 W | 2.10 | 1.56 | 1.44 | 0.95 |
| 450 W | 2.36 | 1.75 | 1.63 | 1.07 |
| 500 W | 2.62 | 1.94 | 1.81 | 1.19 |
| 550 W | 2.89 | 2.14 | 1.99 | 1.30 |
How Many kWh Does a 400W Solar Panel Produce per Day?
A 400 W panel makes about 0.95 kWh a day in London, 1.44 kWh in New York, 1.56 kWh in Sydney and 2.10 kWh in Phoenix, as a year average. In a year that is 346, 528, 568 and 767 kWh. A quick rule: kWh per day = panel watts / 1000 x peak sun hours x 0.8.
Energy per Square Metre of Panel
A 400 W panel is about 1.13 by 1.72 metres (1.95 square metres), so it has an efficiency of about 20 percent. One square metre of such panels makes about 0.71 kWh a day in New York and 1.03 kWh in Phoenix. To see how many panels fit on a real roof, draw it in the Roof Solar Calculator.
Solar System Output by Size: 1 kW to 20 kW
Output Table by System Size in New York
The output grows in step with the size. The table uses New York, the best tilt and 400 W panels. For any other size, use the tool as a free solar kilowatt calculator: type the kW you want, from 0.1 to 10,000, and it shows the panels and the kWh for your place.
| System size | Panels (400 W) | Panel area | kWh a year | kWh a month | kWh a day |
|---|---|---|---|---|---|
| 1 kW | 3 | 6 m² | 1,319 | 110 | 3.6 |
| 3 kW | 8 | 16 m² | 3,958 | 330 | 10.8 |
| 5 kW | 13 | 25 m² | 6,597 | 550 | 18.1 |
| 8 kW | 20 | 39 m² | 10,555 | 880 | 28.9 |
| 10 kW | 25 | 49 m² | 13,194 | 1,099 | 36.1 |
| 20 kW | 50 | 98 m² | 26,388 | 2,199 | 72.2 |
1 kW Solar System Output per Day
The 1 kW solar system output per day is the same number as the kWh per kWp divided by 365. It is about 2.4 kWh in London, 3.6 kWh in New York, 3.9 kWh in Sydney and 5.2 kWh in Phoenix. Multiply by your size in kW to get the daily output of your system. Remember that a summer day can give twice or three times a winter day.
Tilt and Direction: How Much Energy Do You Lose?
Heat Map of Tilt and Direction in New York
Each cell is the yearly energy of a panel with that tilt and compass direction, as a percent of the best fixed panel. The tool draws this map for the place you pick. The dark outline marks the best cell in the grid.
Tilt and Direction in Numbers
| Tilt | North | North-east | East | South-east | South | South-west | West | North-west |
|---|---|---|---|---|---|---|---|---|
| 0° (flat) | 90% | 90% | 90% | 90% | 90% | 90% | 90% | 90% |
| 15° | 78% | 81% | 88% | 95% | 97% | 95% | 88% | 81% |
| 30° | 64% | 71% | 84% | 96% | 100% | 96% | 84% | 71% |
| 45° | 52% | 61% | 79% | 93% | 98% | 93% | 79% | 61% |
| 60° | 41% | 52% | 71% | 86% | 91% | 86% | 71% | 52% |
| 90° (wall) | 29% | 38% | 54% | 64% | 66% | 64% | 54% | 38% |
East, West, Flat and Wall Panels
In New York a flat panel makes 90 percent of the best. A 30 degree panel facing east makes 84 percent and one facing west 84 percent: less energy, but more of it in the morning or the evening. A vertical panel facing south, on a wall or a balcony rail, makes 66 percent, and more in winter than in summer. The worst choice is a steep panel facing the pole. Close to the equator the tilt matters less, and far from it the tilt matters more.
Summer, Winter and Yearly Output by Location
How Output Changes with the Season
The tool reports the winter half-year, the summer half-year and the whole-year average. In the Northern Hemisphere summer is April to September and winter is October to March. In the Southern Hemisphere they are swapped. The gap between them grows with the latitude and with the winter clouds.
Winter and Summer Output of 5 kW in Four Climates
| 5 kW at the best tilt | Winter kWh a day | Summer kWh a day | Year kWh a day | kWh a year | Summer to winter |
|---|---|---|---|---|---|
| Phoenix, USA (sunny) | 22.8 | 29.7 | 26.2 | 9,585 | 1.3 to 1 |
| Sydney, Australia (average) | 15.2 | 23.7 | 19.4 | 7,101 | 1.6 to 1 |
| New York, USA (average) | 13.8 | 22.3 | 18.1 | 6,597 | 1.6 to 1 |
| London, UK (cloudy) | 7.0 | 16.7 | 11.9 | 4,330 | 2.4 to 1 |
What the Season Gap Means for You
When you are connected to the grid, the yearly kWh is the number that matters: summer surplus goes to the grid and winter gaps come back from it. For an off-grid home, a cabin or a pump, size the system for the winter kWh a day, because that is when power runs short. A battery moves energy from day to night, but not from summer to winter.
Latitude and Climate: Solar Potential by Location
kWh per kWp by Latitude and Sky
This table shows the two things that decide the solar potential of a place: how far it is from the equator, and how cloudy it is. Each figure is the yearly kWh of 1 kWp at the best fixed tilt, with an 80 percent performance ratio.
| Latitude | Best tilt | Sunny sky | Average sky | Cloudy sky | Peak sun hours (average sky) |
|---|---|---|---|---|---|
| 0° | 10° | 2,095 | 1,589 | 1,259 | 5.44 |
| 10° | 10° | 2,099 | 1,586 | 1,252 | 5.43 |
| 20° | 16° | 2,046 | 1,535 | 1,206 | 5.25 |
| 30° | 24° | 1,957 | 1,451 | 1,129 | 4.96 |
| 40° | 32° | 1,821 | 1,330 | 1,023 | 4.55 |
| 50° | 38° | 1,632 | 1,172 | 888 | 4.01 |
| 60° | 43° | 1,387 | 981 | 735 | 3.36 |
Why Clouds Often Matter More Than Latitude
The table shows that the sky can change the energy by 60 percent or more at the same latitude, while moving 10 degrees closer to the equator changes it much less. This is why Madrid, at the same latitude as New York, gets far more energy, and why a sunny desert at 30° beats a humid tropical coast at 10°. Pick the sky setting that fits your place: sunny for deserts and Mediterranean summers, cloudy for coasts with frequent grey days in the north, average for the rest.
What Size of Solar System Do You Need?
Four Steps to Size a System from Your Location
If you know your bills rather than your appliances, size the system from the yearly kWh. Type your monthly use in the tool and it works as a free solar system calculator: it shows the share of your use that the system covers, and the size you need for all of it. By hand, the steps are:
- Add up 12 months of electricity use from your bills, in kWh. Add the expected use of an electric car or a heat pump if you plan one.
- Find the kWh per kWp of your location in the tool (or in the city tables below).
- Divide the yearly use by the kWh per kWp to get the system size in kWp.
- Divide the kWp by the panel size in kW and round up to get the number of panels. Then check that they fit on your roof.
Worked Example: A Home That Uses 700 kWh a Month
A home in New York uses 700 kWh a month, 8,400 kWh a year. At 1,319 kWh per kWp it needs 8,400 / 1,319 = 6.4 kWp, or 16 panels of 400 W. The 5 kW example system covers 79 percent of the use. In London the same home would need about 9.7 kWp, and in Phoenix about 4.4 kWp.
Value of the Energy and Carbon Saved
What the Energy Is Worth
The tool multiplies the yearly kWh by your power price. At $0.16 per kWh, the 6,597 kWh of the New York example are worth about $1,056 a year. This is the full value when you use all the power yourself. Power you send to the grid often earns less than the price you pay, so the real saving depends on how much you use at home, on your tariff and on net metering rules. Currency and price change with the location, and you can set them yourself.
Carbon Saved
With an average grid that emits 0.4 kg of CO2 per kWh, the New York example saves about 2.6 tonnes of CO2 a year. A clean grid with a lot of hydro or nuclear power gives a smaller saving, and a coal-heavy grid a larger one.
Solar Energy by City: Peak Sun Hours and kWh per kWp in 220 Cities
How the City Numbers Are Calculated
These tables list the peak sun hours and the yearly kWh per kWp in 100 US cities, 100 European cities, 10 Australian cities and 10 UK cities. Each row uses panels at the best fixed tilt facing the equator, an 80 percent performance ratio and the typical climate of the city. The last three columns are for a 5 kW system: the kWh a day in the winter and summer half-years, and the kWh a year. For any other place, click it on the map above.
Solar Panel Output in 100 US Cities
| # | City | State | Latitude | Climate | Best tilt | Peak sun hours | kWh per kWp a year | 5 kW winter kWh/day | 5 kW summer kWh/day | 5 kW kWh a year |
|---|---|---|---|---|---|---|---|---|---|---|
| 1 | New York | NY | 40.71° N | Average | 32° | 4.52 | 1,319 | 13.8 | 22.3 | 6,597 |
| 2 | Los Angeles | CA | 34.05° N | Sunny | 30° | 6.53 | 1,909 | 22.6 | 29.6 | 9,546 |
| 3 | Chicago | IL | 41.88° N | Average | 33° | 4.46 | 1,304 | 13.5 | 22.2 | 6,521 |
| 4 | Houston | TX | 29.76° N | Average | 24° | 4.97 | 1,453 | 17.0 | 22.8 | 7,265 |
| 5 | Phoenix | AZ | 33.45° N | Sunny | 30° | 6.56 | 1,917 | 22.8 | 29.7 | 9,585 |
| 6 | Philadelphia | PA | 39.95° N | Average | 31° | 4.55 | 1,330 | 14.0 | 22.4 | 6,651 |
| 7 | San Antonio | TX | 29.42° N | Sunny | 26° | 6.72 | 1,964 | 24.0 | 29.8 | 9,818 |
| 8 | San Diego | CA | 32.72° N | Sunny | 29° | 6.59 | 1,925 | 23.0 | 29.7 | 9,623 |
| 9 | Dallas | TX | 32.78° N | Average | 26° | 4.86 | 1,420 | 16.2 | 22.7 | 7,101 |
| 10 | San Jose | CA | 37.34° N | Sunny | 33° | 6.38 | 1,863 | 21.4 | 29.5 | 9,315 |
| 11 | Austin | TX | 30.27° N | Average | 24° | 4.95 | 1,448 | 16.8 | 22.8 | 7,239 |
| 12 | Jacksonville | FL | 30.33° N | Average | 24° | 4.95 | 1,447 | 16.8 | 22.8 | 7,236 |
| 13 | San Francisco | CA | 37.77° N | Average | 30° | 4.66 | 1,360 | 14.7 | 22.5 | 6,801 |
| 14 | Columbus | OH | 39.96° N | Average | 31° | 4.55 | 1,330 | 14.0 | 22.4 | 6,651 |
| 15 | Indianapolis | IN | 39.77° N | Average | 31° | 4.56 | 1,333 | 14.1 | 22.4 | 6,664 |
| 16 | Fort Worth | TX | 32.76° N | Average | 26° | 4.86 | 1,420 | 16.2 | 22.7 | 7,102 |
| 17 | Charlotte | NC | 35.23° N | Average | 28° | 4.77 | 1,393 | 15.5 | 22.6 | 6,963 |
| 18 | Seattle | WA | 47.61° N | Cloudy | 33° | 3.16 | 923 | 8.1 | 17.1 | 4,615 |
| 19 | Denver | CO | 39.74° N | Sunny | 35° | 6.25 | 1,825 | 20.5 | 29.4 | 9,126 |
| 20 | Washington | DC | 38.91° N | Average | 31° | 4.60 | 1,345 | 14.4 | 22.4 | 6,724 |
| 21 | Boston | MA | 42.36° N | Average | 33° | 4.44 | 1,297 | 13.3 | 22.2 | 6,485 |
| 22 | El Paso | TX | 31.76° N | Sunny | 28° | 6.63 | 1,936 | 23.3 | 29.7 | 9,682 |
| 23 | Nashville | TN | 36.16° N | Average | 29° | 4.73 | 1,381 | 15.2 | 22.6 | 6,905 |
| 24 | Detroit | MI | 42.33° N | Cloudy | 30° | 3.40 | 995 | 9.6 | 17.6 | 4,973 |
| 25 | Oklahoma City | OK | 35.47° N | Average | 28° | 4.76 | 1,390 | 15.4 | 22.6 | 6,949 |
| 26 | Portland | OR | 45.52° N | Cloudy | 31° | 3.26 | 952 | 8.7 | 17.3 | 4,761 |
| 27 | Las Vegas | NV | 36.17° N | Sunny | 32° | 6.43 | 1,880 | 21.9 | 29.6 | 9,400 |
| 28 | Memphis | TN | 35.15° N | Average | 28° | 4.77 | 1,394 | 15.5 | 22.6 | 6,968 |
| 29 | Louisville | KY | 38.25° N | Average | 30° | 4.63 | 1,354 | 14.6 | 22.5 | 6,769 |
| 30 | Baltimore | MD | 39.29° N | Average | 31° | 4.58 | 1,340 | 14.3 | 22.4 | 6,698 |
| 31 | Milwaukee | WI | 43.04° N | Average | 34° | 4.40 | 1,287 | 13.1 | 22.1 | 6,434 |
| 32 | Albuquerque | NM | 35.08° N | Sunny | 31° | 6.49 | 1,895 | 22.3 | 29.6 | 9,476 |
| 33 | Tucson | AZ | 32.22° N | Sunny | 29° | 6.61 | 1,931 | 23.2 | 29.7 | 9,654 |
| 34 | Fresno | CA | 36.74° N | Sunny | 32° | 6.41 | 1,872 | 21.7 | 29.6 | 9,359 |
| 35 | Sacramento | CA | 38.58° N | Sunny | 34° | 6.31 | 1,844 | 21.0 | 29.5 | 9,220 |
| 36 | Kansas City | MO | 39.10° N | Average | 31° | 4.59 | 1,342 | 14.3 | 22.4 | 6,711 |
| 37 | Atlanta | GA | 33.75° N | Average | 27° | 4.83 | 1,410 | 16.0 | 22.7 | 7,052 |
| 38 | Omaha | NE | 41.26° N | Average | 32° | 4.49 | 1,312 | 13.6 | 22.3 | 6,558 |
| 39 | Colorado Springs | CO | 38.83° N | Sunny | 34° | 6.30 | 1,840 | 20.9 | 29.5 | 9,201 |
| 40 | Raleigh | NC | 35.78° N | Average | 29° | 4.74 | 1,386 | 15.4 | 22.6 | 6,929 |
| 41 | Miami | FL | 25.76° N | Average | 21° | 5.10 | 1,491 | 18.0 | 22.8 | 7,457 |
| 42 | Minneapolis | MN | 44.98° N | Average | 35° | 4.30 | 1,256 | 12.4 | 22.0 | 6,282 |
| 43 | Tampa | FL | 27.95° N | Average | 23° | 5.03 | 1,471 | 17.5 | 22.8 | 7,356 |
| 44 | New Orleans | LA | 29.95° N | Average | 24° | 4.97 | 1,451 | 16.9 | 22.8 | 7,256 |
| 45 | Salt Lake City | UT | 40.76° N | Sunny | 35° | 6.19 | 1,809 | 20.1 | 29.4 | 9,043 |
| 46 | Honolulu | HI | 21.31° N | Sunny | 19° | 6.97 | 2,036 | 26.0 | 29.7 | 10,181 |
| 47 | Anchorage | AK | 61.22° N | Cloudy | 38° | 2.45 | 716 | 4.1 | 15.5 | 3,578 |
| 48 | Pittsburgh | PA | 40.44° N | Cloudy | 28° | 3.48 | 1,017 | 10.1 | 17.7 | 5,086 |
| 49 | Cleveland | OH | 41.50° N | Cloudy | 29° | 3.44 | 1,005 | 9.9 | 17.6 | 5,026 |
| 50 | St. Louis | MO | 38.63° N | Average | 31° | 4.62 | 1,349 | 14.5 | 22.4 | 6,743 |
| 51 | Tulsa | OK | 36.15° N | Average | 29° | 4.73 | 1,381 | 15.2 | 22.6 | 6,906 |
| 52 | Wichita | KS | 37.69° N | Average | 30° | 4.66 | 1,361 | 14.8 | 22.5 | 6,807 |
| 53 | Bakersfield | CA | 35.37° N | Sunny | 31° | 6.47 | 1,891 | 22.2 | 29.6 | 9,456 |
| 54 | Aurora | CO | 39.73° N | Sunny | 35° | 6.25 | 1,825 | 20.5 | 29.4 | 9,127 |
| 55 | Anaheim | CA | 33.84° N | Sunny | 30° | 6.54 | 1,912 | 22.7 | 29.6 | 9,560 |
| 56 | Riverside | CA | 33.95° N | Sunny | 30° | 6.54 | 1,911 | 22.7 | 29.6 | 9,553 |
| 57 | Corpus Christi | TX | 27.80° N | Average | 23° | 5.04 | 1,473 | 17.5 | 22.8 | 7,363 |
| 58 | Lexington | KY | 38.04° N | Average | 30° | 4.64 | 1,357 | 14.7 | 22.5 | 6,783 |
| 59 | Stockton | CA | 37.96° N | Sunny | 33° | 6.34 | 1,854 | 21.2 | 29.5 | 9,268 |
| 60 | Henderson | NV | 36.04° N | Sunny | 32° | 6.44 | 1,882 | 21.9 | 29.6 | 9,409 |
| 61 | Saint Paul | MN | 44.95° N | Average | 35° | 4.30 | 1,257 | 12.4 | 22.0 | 6,284 |
| 62 | Cincinnati | OH | 39.10° N | Average | 31° | 4.59 | 1,342 | 14.3 | 22.4 | 6,711 |
| 63 | St. Petersburg | FL | 27.77° N | Average | 23° | 5.04 | 1,473 | 17.5 | 22.8 | 7,364 |
| 64 | Greensboro | NC | 36.07° N | Average | 29° | 4.73 | 1,382 | 15.3 | 22.6 | 6,911 |
| 65 | Newark | NJ | 40.74° N | Average | 32° | 4.51 | 1,319 | 13.8 | 22.3 | 6,595 |
| 66 | Lincoln | NE | 40.81° N | Average | 32° | 4.51 | 1,318 | 13.8 | 22.3 | 6,590 |
| 67 | Toledo | OH | 41.65° N | Cloudy | 29° | 3.43 | 1,003 | 9.8 | 17.6 | 5,016 |
| 68 | Orlando | FL | 28.54° N | Average | 23° | 5.01 | 1,465 | 17.3 | 22.8 | 7,327 |
| 69 | Chandler | AZ | 33.31° N | Sunny | 30° | 6.57 | 1,919 | 22.9 | 29.7 | 9,594 |
| 70 | Fort Wayne | IN | 41.08° N | Cloudy | 29° | 3.45 | 1,009 | 10.0 | 17.7 | 5,046 |
| 71 | Buffalo | NY | 42.89° N | Cloudy | 30° | 3.38 | 987 | 9.5 | 17.5 | 4,937 |
| 72 | Durham | NC | 35.99° N | Average | 29° | 4.73 | 1,383 | 15.3 | 22.6 | 6,916 |
| 73 | Madison | WI | 43.07° N | Average | 34° | 4.40 | 1,286 | 13.1 | 22.1 | 6,431 |
| 74 | Lubbock | TX | 33.58° N | Sunny | 30° | 6.55 | 1,915 | 22.8 | 29.7 | 9,577 |
| 75 | Scottsdale | AZ | 33.49° N | Sunny | 30° | 6.56 | 1,917 | 22.8 | 29.7 | 9,583 |
| 76 | Reno | NV | 39.53° N | Sunny | 34° | 6.26 | 1,829 | 20.6 | 29.5 | 9,146 |
| 77 | Norfolk | VA | 36.85° N | Average | 29° | 4.70 | 1,372 | 15.0 | 22.5 | 6,861 |
| 78 | Boise | ID | 43.62° N | Sunny | 38° | 6.02 | 1,760 | 19.0 | 29.2 | 8,801 |
| 79 | Richmond | VA | 37.54° N | Average | 30° | 4.67 | 1,363 | 14.8 | 22.5 | 6,816 |
| 80 | Spokane | WA | 47.66° N | Average | 37° | 4.15 | 1,212 | 11.5 | 21.7 | 6,061 |
| 81 | Des Moines | IA | 41.59° N | Average | 33° | 4.48 | 1,309 | 13.6 | 22.2 | 6,543 |
| 82 | Birmingham | AL | 33.52° N | Average | 27° | 4.84 | 1,413 | 16.0 | 22.7 | 7,066 |
| 83 | Rochester | NY | 43.16° N | Cloudy | 30° | 3.37 | 984 | 9.4 | 17.5 | 4,919 |
| 84 | Boulder | CO | 40.01° N | Sunny | 35° | 6.23 | 1,821 | 20.4 | 29.4 | 9,105 |
| 85 | Santa Fe | NM | 35.69° N | Sunny | 32° | 6.46 | 1,887 | 22.1 | 29.6 | 9,434 |
| 86 | Charleston | SC | 32.78° N | Average | 26° | 4.86 | 1,420 | 16.2 | 22.7 | 7,101 |
| 87 | Savannah | GA | 32.08° N | Average | 26° | 4.89 | 1,428 | 16.4 | 22.7 | 7,141 |
| 88 | Burlington | VT | 44.48° N | Cloudy | 31° | 3.31 | 966 | 9.0 | 17.4 | 4,831 |
| 89 | Portland | ME | 43.66° N | Average | 34° | 4.37 | 1,277 | 12.9 | 22.1 | 6,385 |
| 90 | Fargo | ND | 46.88° N | Average | 36° | 4.19 | 1,225 | 11.7 | 21.8 | 6,127 |
| 91 | Billings | MT | 45.78° N | Average | 35° | 4.26 | 1,243 | 12.1 | 21.9 | 6,217 |
| 92 | Cheyenne | WY | 41.14° N | Sunny | 36° | 6.17 | 1,802 | 20.0 | 29.4 | 9,011 |
| 93 | Sioux Falls | SD | 43.55° N | Average | 34° | 4.38 | 1,279 | 12.9 | 22.1 | 6,393 |
| 94 | Little Rock | AR | 34.75° N | Average | 28° | 4.79 | 1,399 | 15.6 | 22.6 | 6,993 |
| 95 | Jackson | MS | 32.30° N | Average | 26° | 4.88 | 1,426 | 16.3 | 22.7 | 7,129 |
| 96 | Baton Rouge | LA | 30.45° N | Average | 25° | 4.95 | 1,446 | 16.8 | 22.8 | 7,229 |
| 97 | Charleston | WV | 38.35° N | Cloudy | 27° | 3.57 | 1,042 | 10.7 | 17.8 | 5,212 |
| 98 | Wilmington | DE | 39.74° N | Average | 31° | 4.56 | 1,333 | 14.1 | 22.4 | 6,666 |
| 99 | Providence | RI | 41.82° N | Average | 33° | 4.47 | 1,305 | 13.5 | 22.2 | 6,525 |
| 100 | Juneau | AK | 58.30° N | Cloudy | 37° | 2.60 | 761 | 4.9 | 15.9 | 3,806 |
Solar Panel Output in 100 European Cities
| # | City | Country | Latitude | Climate | Best tilt | Peak sun hours | kWh per kWp a year | 5 kW winter kWh/day | 5 kW summer kWh/day | 5 kW kWh a year |
|---|---|---|---|---|---|---|---|---|---|---|
| 1 | London | United Kingdom | 51.51° N | Cloudy | 35° | 2.96 | 866 | 7.0 | 16.7 | 4,330 |
| 2 | Paris | France | 48.86° N | Average | 37° | 4.08 | 1,192 | 11.0 | 21.6 | 5,959 |
| 3 | Berlin | Germany | 52.52° N | Cloudy | 35° | 2.91 | 851 | 6.6 | 16.6 | 4,253 |
| 4 | Madrid | Spain | 40.42° N | Sunny | 35° | 6.21 | 1,814 | 20.3 | 29.4 | 9,071 |
| 5 | Rome | Italy | 41.90° N | Sunny | 36° | 6.13 | 1,791 | 19.7 | 29.3 | 8,956 |
| 6 | Barcelona | Spain | 41.39° N | Sunny | 36° | 6.15 | 1,798 | 19.8 | 29.4 | 8,989 |
| 7 | Vienna | Austria | 48.21° N | Average | 37° | 4.12 | 1,203 | 11.2 | 21.7 | 6,015 |
| 8 | Amsterdam | Netherlands | 52.37° N | Cloudy | 35° | 2.92 | 853 | 6.7 | 16.6 | 4,264 |
| 9 | Brussels | Belgium | 50.85° N | Cloudy | 34° | 3.00 | 876 | 7.2 | 16.8 | 4,379 |
| 10 | Lisbon | Portugal | 38.72° N | Sunny | 34° | 6.30 | 1,842 | 20.9 | 29.5 | 9,210 |
| 11 | Athens | Greece | 37.98° N | Sunny | 33° | 6.34 | 1,853 | 21.2 | 29.5 | 9,267 |
| 12 | Dublin | Ireland | 53.35° N | Cloudy | 35° | 2.87 | 838 | 6.4 | 16.5 | 4,190 |
| 13 | Stockholm | Sweden | 59.33° N | Cloudy | 38° | 2.55 | 745 | 4.6 | 15.8 | 3,726 |
| 14 | Oslo | Norway | 59.91° N | Cloudy | 38° | 2.52 | 736 | 4.4 | 15.7 | 3,681 |
| 15 | Copenhagen | Denmark | 55.68° N | Cloudy | 36° | 2.74 | 802 | 5.7 | 16.2 | 4,010 |
| 16 | Helsinki | Finland | 60.17° N | Cloudy | 38° | 2.51 | 732 | 4.4 | 15.6 | 3,661 |
| 17 | Warsaw | Poland | 52.23° N | Cloudy | 35° | 2.93 | 855 | 6.7 | 16.7 | 4,275 |
| 18 | Prague | Czechia | 50.08° N | Average | 38° | 4.00 | 1,170 | 10.6 | 21.5 | 5,851 |
| 19 | Budapest | Hungary | 47.50° N | Average | 37° | 4.16 | 1,215 | 11.5 | 21.7 | 6,075 |
| 20 | Munich | Germany | 48.14° N | Average | 37° | 4.12 | 1,204 | 11.3 | 21.7 | 6,021 |
| 21 | Hamburg | Germany | 53.55° N | Cloudy | 35° | 2.86 | 835 | 6.3 | 16.5 | 4,175 |
| 22 | Frankfurt | Germany | 50.11° N | Average | 38° | 4.00 | 1,170 | 10.6 | 21.4 | 5,848 |
| 23 | Cologne | Germany | 50.94° N | Cloudy | 34° | 2.99 | 874 | 7.1 | 16.8 | 4,372 |
| 24 | Zurich | Switzerland | 47.38° N | Average | 36° | 4.17 | 1,217 | 11.5 | 21.8 | 6,085 |
| 25 | Geneva | Switzerland | 46.20° N | Average | 36° | 4.23 | 1,237 | 12.0 | 21.8 | 6,183 |
| 26 | Milan | Italy | 45.46° N | Average | 35° | 4.27 | 1,249 | 12.2 | 21.9 | 6,243 |
| 27 | Naples | Italy | 40.85° N | Sunny | 35° | 6.18 | 1,807 | 20.1 | 29.4 | 9,035 |
| 28 | Turin | Italy | 45.07° N | Average | 35° | 4.29 | 1,255 | 12.4 | 21.9 | 6,274 |
| 29 | Florence | Italy | 43.77° N | Sunny | 38° | 6.01 | 1,757 | 18.9 | 29.2 | 8,787 |
| 30 | Venice | Italy | 45.44° N | Average | 35° | 4.27 | 1,249 | 12.3 | 21.9 | 6,245 |
| 31 | Palermo | Italy | 38.12° N | Sunny | 33° | 6.34 | 1,851 | 21.1 | 29.5 | 9,256 |
| 32 | Seville | Spain | 37.39° N | Sunny | 33° | 6.37 | 1,862 | 21.4 | 29.6 | 9,311 |
| 33 | Valencia | Spain | 39.47° N | Sunny | 34° | 6.26 | 1,830 | 20.6 | 29.5 | 9,150 |
| 34 | Malaga | Spain | 36.72° N | Sunny | 32° | 6.41 | 1,872 | 21.7 | 29.6 | 9,361 |
| 35 | Porto | Portugal | 41.15° N | Average | 32° | 4.49 | 1,313 | 13.7 | 22.3 | 6,566 |
| 36 | Marseille | France | 43.30° N | Sunny | 37° | 6.05 | 1,766 | 19.1 | 29.2 | 8,832 |
| 37 | Lyon | France | 45.76° N | Average | 35° | 4.26 | 1,244 | 12.1 | 21.9 | 6,219 |
| 38 | Nice | France | 43.70° N | Sunny | 38° | 6.02 | 1,759 | 19.0 | 29.2 | 8,794 |
| 39 | Edinburgh | United Kingdom | 55.95° N | Cloudy | 36° | 2.73 | 798 | 5.6 | 16.2 | 3,989 |
| 40 | Manchester | United Kingdom | 53.48° N | Cloudy | 35° | 2.86 | 836 | 6.4 | 16.5 | 4,180 |
| 41 | Glasgow | United Kingdom | 55.86° N | Cloudy | 36° | 2.74 | 799 | 5.6 | 16.2 | 3,996 |
| 42 | Birmingham | United Kingdom | 52.49° N | Cloudy | 35° | 2.91 | 851 | 6.6 | 16.6 | 4,255 |
| 43 | Reykjavik | Iceland | 64.15° N | Cloudy | 39° | 2.29 | 670 | 3.3 | 15.0 | 3,352 |
| 44 | Bucharest | Romania | 44.43° N | Average | 35° | 4.33 | 1,265 | 12.6 | 22.0 | 6,325 |
| 45 | Sofia | Bulgaria | 42.70° N | Average | 33° | 4.42 | 1,292 | 13.2 | 22.2 | 6,459 |
| 46 | Belgrade | Serbia | 44.79° N | Average | 35° | 4.31 | 1,259 | 12.5 | 22.0 | 6,297 |
| 47 | Zagreb | Croatia | 45.81° N | Average | 35° | 4.25 | 1,243 | 12.1 | 21.9 | 6,215 |
| 48 | Kyiv | Ukraine | 50.45° N | Average | 38° | 3.98 | 1,164 | 10.4 | 21.4 | 5,818 |
| 49 | Moscow | Russia | 55.76° N | Cloudy | 36° | 2.74 | 801 | 5.7 | 16.2 | 4,004 |
| 50 | Valletta | Malta | 35.90° N | Sunny | 32° | 6.45 | 1,884 | 22.0 | 29.6 | 9,419 |
| 51 | Stuttgart | Germany | 48.78° N | Average | 37° | 4.08 | 1,193 | 11.0 | 21.6 | 5,966 |
| 52 | Dusseldorf | Germany | 51.23° N | Cloudy | 34° | 2.98 | 870 | 7.0 | 16.8 | 4,351 |
| 53 | Dresden | Germany | 51.05° N | Average | 39° | 3.95 | 1,153 | 10.2 | 21.3 | 5,764 |
| 54 | Leipzig | Germany | 51.34° N | Average | 39° | 3.93 | 1,147 | 10.1 | 21.3 | 5,737 |
| 55 | Nuremberg | Germany | 49.45° N | Average | 38° | 4.04 | 1,181 | 10.8 | 21.5 | 5,906 |
| 56 | Bremen | Germany | 53.08° N | Cloudy | 35° | 2.88 | 842 | 6.5 | 16.6 | 4,210 |
| 57 | Hanover | Germany | 52.37° N | Cloudy | 35° | 2.92 | 853 | 6.7 | 16.6 | 4,264 |
| 58 | Bologna | Italy | 44.49° N | Average | 35° | 4.33 | 1,264 | 12.6 | 22.0 | 6,320 |
| 59 | Genoa | Italy | 44.41° N | Sunny | 38° | 5.97 | 1,746 | 18.6 | 29.1 | 8,728 |
| 60 | Bari | Italy | 41.12° N | Sunny | 36° | 6.17 | 1,802 | 20.0 | 29.4 | 9,012 |
| 61 | Catania | Italy | 37.50° N | Sunny | 33° | 6.37 | 1,861 | 21.4 | 29.6 | 9,303 |
| 62 | Verona | Italy | 45.44° N | Average | 35° | 4.27 | 1,249 | 12.3 | 21.9 | 6,245 |
| 63 | Zaragoza | Spain | 41.65° N | Sunny | 36° | 6.14 | 1,795 | 19.8 | 29.3 | 8,977 |
| 64 | Bilbao | Spain | 43.26° N | Average | 34° | 4.39 | 1,283 | 13.0 | 22.1 | 6,417 |
| 65 | Granada | Spain | 37.18° N | Sunny | 33° | 6.38 | 1,865 | 21.5 | 29.5 | 9,326 |
| 66 | Murcia | Spain | 37.99° N | Sunny | 33° | 6.34 | 1,853 | 21.2 | 29.5 | 9,266 |
| 67 | Alicante | Spain | 38.35° N | Sunny | 34° | 6.32 | 1,848 | 21.1 | 29.5 | 9,238 |
| 68 | Palma | Spain | 39.57° N | Sunny | 34° | 6.26 | 1,828 | 20.6 | 29.5 | 9,140 |
| 69 | Cordoba | Spain | 37.89° N | Sunny | 33° | 6.35 | 1,855 | 21.2 | 29.5 | 9,273 |
| 70 | Coimbra | Portugal | 40.21° N | Average | 32° | 4.54 | 1,327 | 14.0 | 22.3 | 6,633 |
| 71 | Faro | Portugal | 37.02° N | Sunny | 33° | 6.39 | 1,868 | 21.6 | 29.5 | 9,338 |
| 72 | Toulouse | France | 43.60° N | Average | 34° | 4.37 | 1,278 | 12.9 | 22.1 | 6,390 |
| 73 | Bordeaux | France | 44.84° N | Average | 35° | 4.31 | 1,259 | 12.5 | 22.0 | 6,293 |
| 74 | Nantes | France | 47.22° N | Average | 36° | 4.17 | 1,220 | 11.6 | 21.8 | 6,098 |
| 75 | Strasbourg | France | 48.57° N | Average | 37° | 4.10 | 1,197 | 11.1 | 21.6 | 5,984 |
| 76 | Lille | France | 50.63° N | Cloudy | 34° | 3.01 | 879 | 7.2 | 16.8 | 4,395 |
| 77 | Montpellier | France | 43.61° N | Sunny | 38° | 6.02 | 1,760 | 19.0 | 29.2 | 8,802 |
| 78 | Antwerp | Belgium | 51.22° N | Cloudy | 34° | 2.98 | 870 | 7.0 | 16.8 | 4,351 |
| 79 | Rotterdam | Netherlands | 51.92° N | Cloudy | 35° | 2.94 | 860 | 6.8 | 16.7 | 4,299 |
| 80 | The Hague | Netherlands | 52.08° N | Cloudy | 35° | 2.93 | 857 | 6.8 | 16.7 | 4,286 |
| 81 | Utrecht | Netherlands | 52.09° N | Cloudy | 35° | 2.93 | 857 | 6.8 | 16.7 | 4,285 |
| 82 | Luxembourg | Luxembourg | 49.61° N | Cloudy | 34° | 3.06 | 894 | 7.5 | 16.9 | 4,471 |
| 83 | Bern | Switzerland | 46.95° N | Average | 36° | 4.19 | 1,224 | 11.7 | 21.8 | 6,121 |
| 84 | Basel | Switzerland | 47.56° N | Average | 37° | 4.15 | 1,214 | 11.5 | 21.7 | 6,070 |
| 85 | Salzburg | Austria | 47.81° N | Average | 37° | 4.14 | 1,210 | 11.4 | 21.7 | 6,049 |
| 86 | Graz | Austria | 47.07° N | Average | 36° | 4.18 | 1,222 | 11.7 | 21.8 | 6,111 |
| 87 | Gothenburg | Sweden | 57.71° N | Cloudy | 37° | 2.64 | 770 | 5.1 | 16.0 | 3,852 |
| 88 | Malmo | Sweden | 55.60° N | Cloudy | 36° | 2.75 | 803 | 5.7 | 16.3 | 4,016 |
| 89 | Bergen | Norway | 60.39° N | Cloudy | 38° | 2.49 | 729 | 4.3 | 15.6 | 3,644 |
| 90 | Aarhus | Denmark | 56.16° N | Cloudy | 37° | 2.72 | 794 | 5.6 | 16.2 | 3,972 |
| 91 | Tallinn | Estonia | 59.44° N | Cloudy | 38° | 2.54 | 743 | 4.6 | 15.7 | 3,717 |
| 92 | Riga | Latvia | 56.95° N | Cloudy | 37° | 2.68 | 782 | 5.3 | 16.1 | 3,911 |
| 93 | Vilnius | Lithuania | 54.69° N | Cloudy | 36° | 2.80 | 817 | 6.0 | 16.4 | 4,087 |
| 94 | Krakow | Poland | 50.06° N | Average | 38° | 4.01 | 1,170 | 10.6 | 21.5 | 5,852 |
| 95 | Gdansk | Poland | 54.35° N | Cloudy | 36° | 2.81 | 823 | 6.1 | 16.4 | 4,113 |
| 96 | Bratislava | Slovakia | 48.15° N | Average | 37° | 4.12 | 1,204 | 11.3 | 21.7 | 6,020 |
| 97 | Ljubljana | Slovenia | 46.06° N | Average | 36° | 4.24 | 1,239 | 12.0 | 21.9 | 6,194 |
| 98 | Thessaloniki | Greece | 40.64° N | Sunny | 35° | 6.20 | 1,811 | 20.2 | 29.4 | 9,053 |
| 99 | Nicosia | Cyprus | 35.19° N | Sunny | 31° | 6.48 | 1,894 | 22.2 | 29.6 | 9,469 |
| 100 | Split | Croatia | 43.51° N | Sunny | 37° | 6.03 | 1,762 | 19.0 | 29.2 | 8,811 |
Solar Panel Output in 10 Australian Cities
Australia is in the Southern Hemisphere, so summer is October to March, winter is April to September, and the panels face north.
| # | City | State | Latitude | Climate | Best tilt | Peak sun hours | kWh per kWp a year | 5 kW winter kWh/day | 5 kW summer kWh/day | 5 kW kWh a year |
|---|---|---|---|---|---|---|---|---|---|---|
| 1 | Sydney | NSW | 33.87° S | Average | 26° | 4.86 | 1,420 | 15.2 | 23.7 | 7,101 |
| 2 | Melbourne | VIC | 37.81° S | Average | 29° | 4.70 | 1,372 | 14.1 | 23.5 | 6,861 |
| 3 | Brisbane | QLD | 27.47° S | Sunny | 24° | 6.82 | 1,994 | 23.4 | 31.2 | 9,968 |
| 4 | Perth | WA | 31.95° S | Sunny | 28° | 6.66 | 1,945 | 22.2 | 31.1 | 9,726 |
| 5 | Adelaide | SA | 34.93° S | Sunny | 30° | 6.54 | 1,910 | 21.3 | 31.0 | 9,549 |
| 6 | Canberra | ACT | 35.28° S | Sunny | 30° | 6.52 | 1,905 | 21.2 | 31.0 | 9,526 |
| 7 | Hobart | TAS | 42.88° S | Cloudy | 29° | 3.42 | 1000 | 9.1 | 18.3 | 5,000 |
| 8 | Darwin | NT | 12.46° S | Sunny | 11° | 7.16 | 2,093 | 26.6 | 30.7 | 10,466 |
| 9 | Gold Coast | QLD | 28.02° S | Sunny | 24° | 6.80 | 1,988 | 23.3 | 31.2 | 9,941 |
| 10 | Newcastle | NSW | 32.93° S | Average | 26° | 4.90 | 1,431 | 15.5 | 23.7 | 7,154 |
Solar Panel Output in 10 UK Cities
| # | City | Nation | Latitude | Climate | Best tilt | Peak sun hours | kWh per kWp a year | 5 kW winter kWh/day | 5 kW summer kWh/day | 5 kW kWh a year |
|---|---|---|---|---|---|---|---|---|---|---|
| 1 | London | England | 51.51° N | Cloudy | 35° | 2.96 | 866 | 7.0 | 16.7 | 4,330 |
| 2 | Birmingham | England | 52.49° N | Cloudy | 35° | 2.91 | 851 | 6.6 | 16.6 | 4,255 |
| 3 | Manchester | England | 53.48° N | Cloudy | 35° | 2.86 | 836 | 6.4 | 16.5 | 4,180 |
| 4 | Liverpool | England | 53.41° N | Cloudy | 35° | 2.86 | 837 | 6.4 | 16.5 | 4,185 |
| 5 | Bristol | England | 51.45° N | Cloudy | 35° | 2.97 | 867 | 7.0 | 16.7 | 4,334 |
| 6 | Leeds | England | 53.80° N | Cloudy | 36° | 2.84 | 831 | 6.3 | 16.5 | 4,155 |
| 7 | Glasgow | Scotland | 55.86° N | Cloudy | 36° | 2.74 | 799 | 5.6 | 16.2 | 3,996 |
| 8 | Edinburgh | Scotland | 55.95° N | Cloudy | 36° | 2.73 | 798 | 5.6 | 16.2 | 3,989 |
| 9 | Cardiff | Wales | 51.48° N | Cloudy | 35° | 2.97 | 866 | 7.0 | 16.7 | 4,332 |
| 10 | Belfast | Northern Ireland | 54.60° N | Cloudy | 36° | 2.80 | 819 | 6.0 | 16.4 | 4,093 |
How Accurate Is This Photovoltaic Energy Calculator?
What the Model Does Well
The sun geometry is exact for every latitude and month. The atmosphere and cloud model gives realistic sunlight for the chosen sky, and the hourly split handles any tilt and direction. For an open site with no shade, this photovoltaic energy calculator is usually within about 10 percent of tools that use measured weather data. It is quick, free, and works the same way for every country.
What Is Not Included, and How to Check
It does not include shade from trees, hills and buildings, snow cover, dirt, local fog, or the weather of a real year. The three sky settings are typical climates, not the measured weather of your town. For a quote-grade estimate, compare your result with the free NREL PVWatts tool (USA) or PVGIS (Europe and other regions), and ask a certified installer for a site survey.
12 Most Asked Questions About Solar Panel Energy and kWh
How much energy does a solar panel produce per day?
How do I calculate solar panel output by location?
What are peak sun hours, and how many does my location get?
How many kWh does a 1 kW solar system produce per day?
What is a good kWh per kWp for solar panels?
How much do the tilt and the direction of the panels change the energy?
How much less do solar panels produce in winter?
Can I use this as a solar calculator by zip code or address?
How accurate is this solar kWh calculator?
How many solar panels do I need for my electricity use?
What is the solar load calculation formula?
Is this solar calculator free, with no sign-up?
Method, Sources and Credits
Method and Data Sources
- Solar geometry and monthly-average method: Duffie and Beckman, Solar Engineering of Thermal Processes.
- Clear-sky atmosphere: Hottel (1976). Diffuse fraction: Erbs, Klein and Duffie (1982). Hourly split: Collares-Pereira and Rabl (1979). Tilted surface radiation: Liu and Jordan (1963).
- Map: Leaflet. Place search: Nominatim and OpenStreetMap contributors.
- Street, satellite and terrain maps: OpenStreetMap, CARTO and Esri. PDF files are created in your browser with jsPDF, and the location you pick is not stored.